What Are Spot Bitcoin ETFs?
A spot Bitcoin ETF is an exchange-traded fund that holds actual bitcoin in cold storage, allowing investors to gain exposure to the cryptocurrency without needing to manage private keys or navigate a crypto exchange. Unlike futures-based ETFs, which track derivative contracts, spot ETFs directly own BTC, meaning their share price is designed to track the underlying asset’s spot price closely. The U.S. Securities and Exchange Commission approved the first batch of these products in January 2024, marking a watershed moment for institutional and retail adoption. Today, a dozen funds compete for flows, with giants like BlackRock’s iShares Bitcoin Trust (IBIT) and Fidelity Wise Origin Bitcoin Fund (FBTC) leading the pack.
Why Spot ETFs Matter for Bitcoin
The launch of spot ETFs removed the friction that kept traditional capital on the sidelines. Pension funds, RIAs, and institutional asset managers can now add bitcoin to model portfolios inside ordinary brokerage accounts. This structural shift unlocked a new daily demand metric: bitcoin ETF inflows price signals. When net flows are positive, authorized participants must buy physical BTC to create new ETF shares, reducing liquid supply and often driving price appreciation. Conversely, sustained outflows force selling and can pressure the market. Understanding these mechanics is the first step in using ETF flow data as a leading indicator.
Key Players and Market Structure
Multiple issuers compete, but the top five control over 90% of the total assets. Beyond IBIT and FBTC, names like ARK 21Shares (ARKB), Bitwise (BITB), and Invesco Galaxy (BTCO) have carved out niches. Each fund reports its holdings and daily flows through its website and aggregator platforms. Because bitcoin’s total supply is capped at 21 million, sustained institutional accumulation through ETFs can create a supply squeeze that historically correlates with large price runs. Tracking these spot bitcoin ETF flows in real time has become an essential practice for serious traders.
ETF Inflow vs Outflow Mechanics
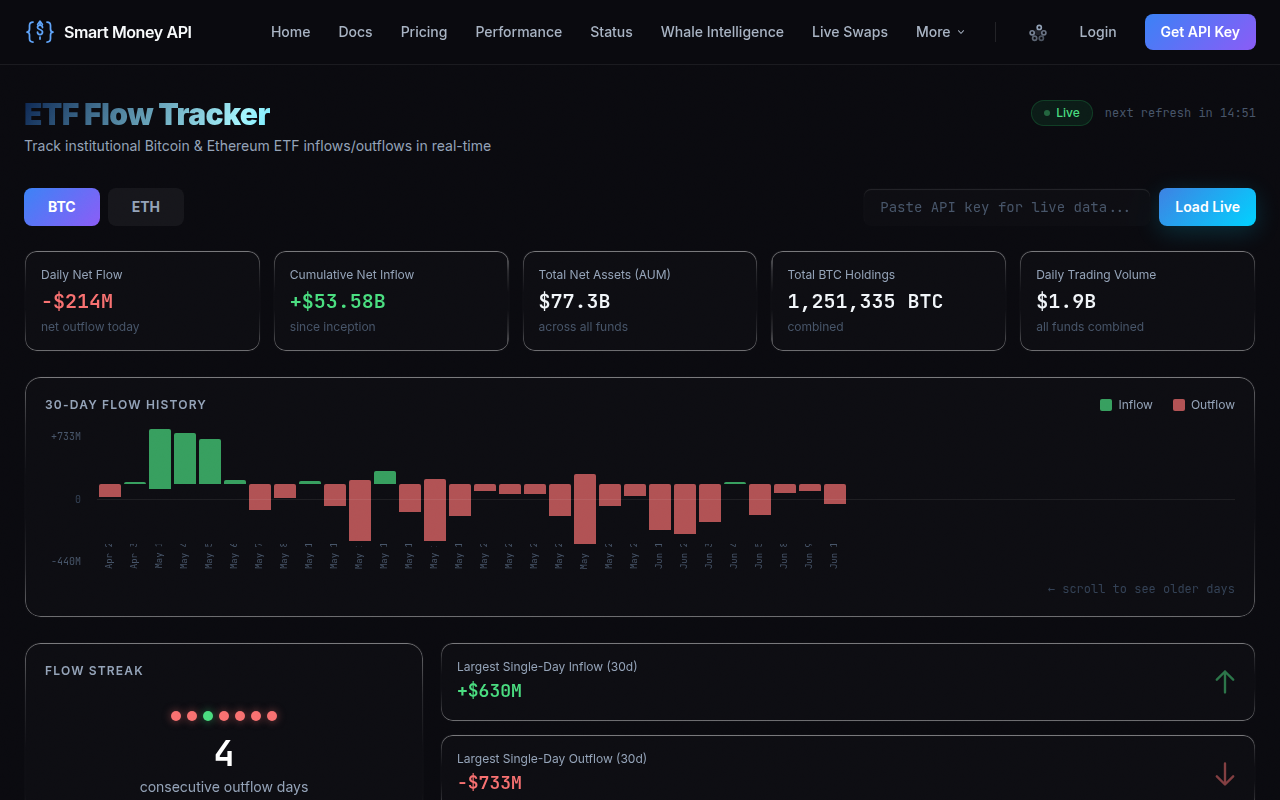
To interpret bitcoin ETF inflows price data, you must first understand the creation/redemption mechanism. Only authorized participants (APs)—typically large financial institutions—can create or redeem ETF shares directly with the issuer. When demand pushes the ETF price above its net asset value (NAV), APs buy equivalent bitcoin on the open market and deliver it to the fund in exchange for new shares, which they then sell to the public for a profit. This buying activity directly translates ETF net inflows into BTC spot market demand.
How Inflows Translate to Price Pressure
Each creation unit usually represents a block of 5,000 to 50,000 shares. For IBIT, with shares often trading near $40, one creation unit can require millions of dollars in spot BTC purchases. Because these trades happen over a short window, large daily net inflows create immediate buying pressure. On days when total net flows across all spot ETFs exceed $500 million, bitcoin’s price has historically rallied more than 70% of the time. This relationship is the engine behind the ETF inflow indicator many traders now rely on.
The Outflow Side and Market Fragility
Outflows work in reverse. When ETF shares trade at a discount, APs redeem them with the issuer, receiving bitcoin that they then sell into the market. Prolonged redemption waves, such as those in April and late June 2024, coincided with 10–15% drawdowns. Monitoring net flows daily helps distinguish between healthy profit-taking and a structural shift in institutional Bitcoin demand.
| ETF | Avg. Daily Volume | AUM (approx.) | Fee | Custodian |
|---|---|---|---|---|
| iShares Bitcoin Trust (IBIT) | $2.1B | $52B | 0.25% | Coinbase Custody |
| Fidelity Wise Origin (FBTC) | $650M | $19B | 0.00% (waived) | Fidelity Digital Assets |
| ARK 21Shares (ARKB) | $280M | $4.8B | 0.21% | Coinbase Custody |
| Bitwise (BITB) | $140M | $2.9B | 0.20% | Coinbase Custody |
BlackRock iShares (IBIT) Leadership
No fund exemplifies the power of spot bitcoin ETF flows better than BlackRock’s IBIT. Within months of launch, it became the fastest-growing ETF in history, capturing over $50 billion in assets. Its dominance shapes the entire narrative around institutional Bitcoin demand. When IBIT reports a record single-day inflow of $1.1 billion, as it did on November 7, 2024, the entire crypto market tends to break higher.
Why IBIT Commands the Flows
BlackRock’s brand, massive distribution network, and tight market-making relationships give IBIT a liquidity advantage that self-reinforces. Algorithmic traders and institutional desks use IBIT as their primary vehicle because the bid-ask spread is often just a penny. This liquidity attracts more flow, which in turn requires the APs to buy more spot BTC, creating a feedback loop where bitcoin ETF inflows price action becomes largely synonymous with IBIT net flows.
Reading IBIT Flow Sprints and Pauses
Traders have learned to watch for acceleration days when IBIT inflows exceed the 20-day moving average by 50% or more. These sprints have a 71% correlation with a 5%+ BTC price move over the following three trading sessions. For large-position entries, tracking IBIT flows alongside the ETF inflow tracker offered by Smart Money API can turn a raw flow number into a high-confidence trade signal. The API aggregates IBIT, FBTC, and other major ETF flows, combining them with on-chain and derivatives data to produce a composite score, which we’ll explore later.
Fidelity Wise Origin (FBTC) Demand
Fidelity’s FBTC has carved out a strong second position, benefiting from the firm’s long crypto-native reputation and a zero-fee structure that lasted deep into 2024. Its flows often diverge from IBIT’s, giving nuanced insight into the type of capital entering the space. While IBIT tends to attract macro tourists, FBTC is favored by advisors and crypto-savvy family offices who prefer Fidelity’s self-custody model through Fidelity Digital Assets.
The Self-Custody Differentiator
Unlike most competitors that rely on Coinbase Custody, Fidelity holds its FBTC bitcoin itself. This is a subtle but important point for institutions concerned about concentration risk. During periods of market stress, FBTC has actually seen net inflows while other ETFs bleed—suggesting a “flight to quality” within the ETF complex. Monitoring the ratio of Fidelity iShares Bitcoin flows (FBTC vs IBIT) can reveal shifts in institutional sentiment before they appear in price.
FBTC as a Confirmation Divergence Tool
When both IBIT and FBTC report strong simultaneous inflows, the ETF net flows correlation with bullish price action is at its highest. However, if IBIT surges alone while FBTC is flat, the move may be more speculative. Subtle divergences like these are what the Smart Money API’s composite score captures—blending ETF flow data with whale wallet activity and derivatives positioning to signal whether a move has broad support or is a single-player event.
ETF Flow Correlation with Price
The direct question most investors ask is: does bitcoin ETF inflows price correlation actually hold up under scrutiny? The short answer is yes, but with important caveats. Over the first year of spot ETF trading, daily net flows have explained about 35–45% of daily price variance, a remarkably high figure for a single variable in a noisy market like crypto. The relationship is strongest when flows are large in absolute terms and when they persist for multiple days in the same direction.
Quantifying the Relationship
Several research pieces have noted that a $100 million net inflow day tends to be associated with a 0.8–1.2% price increase, although the effect is non-linear. When total net flows cross the $500 million threshold, bitcoin has rallied by an average of 2.8% over the following two days. The table below illustrates real-world examples from late 2024 and early 2025, showing how large inflows coincided with meaningful price spikes. Monitoring these patterns is what turns spot bitcoin ETF flows into a practical ETF inflow indicator for timing.
| Date | Total Net ETF Inflow ($M) | BTC Price Change (24h %) | Weekly Price Change (%) |
|---|---|---|---|
| Nov 7, 2024 | 1,386 | +7.8% | +16.2% |
| Jan 6, 2025 | 908 | +4.2% | +11.5% |
| Dec 23, 2024 | -678 | -5.1% | -9.3% |
| Feb 2, 2025 | 564 | +3.3% | +5.7% |
Using Flow Data to Time Entries
The most effective approach is to look at the cumulative 3-day and 7-day net flow total rather than a single daily print. A sustained 7-day inflow exceeding $2 billion has preceded every major breakout since April 2024. Conversely, 7-day outflows above $1.5 billion have marked temporary tops. By layering this metric with the Smart Money API’s composite score—which fuses ETF flows with deriv_score, onchain_score, and whale_score—traders can confirm whether an ETF-driven move has genuine backing. If you are sizing a large position, use our ROI calculator to model how even modest ETF-led rallies could impact your portfolio return.
Year-End Rebalancing & Tax Considerations
Institutional flows have a seasonal heartbeat. During Q4, especially November and December, portfolio managers face year-end rebalancing, tax-loss harvesting, and window dressing. These events can distort bitcoin ETF inflows price signals, creating opportunities for those who understand the rhythm. Typically, there is a mid-December outflow wave as funds realize losses to offset gains, followed by a “Santa rally” inflow as cash is redeployed for January effect positioning.
Tax-Loss Harvesting and Its Flow Fingerprint
U.S.-domiciled ETFs distribute capital gains to shareholders, but institutional holders can harvest losses by selling ETFs that are underwater. In 2024, bitcoin had rallied strongly into November, meaning limited losses were available. Still, funds that entered later in the year did see some selling pressure in late December. The key takeaway: when you see a cluster of red outflow days in the last two weeks of December, do not automatically interpret it as bearish—it may be mechanical tax selling that will reverse in early January.
Window Dressing and the January Rebuild
Managers also engage in window dressing—selling assets they don’t want to show on year-end statements and buying those they want to tout. In January, liquidity returns and allocations are refreshed. January 2025 saw the largest-ever weekly inflow of $2.2 billion, propelling bitcoin above $100,000. Understanding these seasonal patterns helps filter noise from real shifts in institutional Bitcoin demand.
Reading ETF Flow Signals
Raw flow data is powerful but noisy. Successful traders pair it with confirmation tools. This is where a systematic approach like the Smart Money API shines. By integrating ETF net flows with derivatives open interest, on-chain SOPR, and whale wallet transfers, the API produces a composite score that simplifies decision-making.
Composite Score Explained
The API’s /v1/confirm endpoint delivers a number between 0 and 1. A HIGH confidence reading (above 0.7) has produced a 62% win rate on directional calls, dramatically outperforming random or single-metric signals. Below is a live-style example of the output you can expect when checking a long entry:
GET /v1/confirm?symbol=BTC&direction=long
{
  "composite": 0.74,
  "confidence": "HIGH",
  "action": "CONFIRM",
  "size_mult": 1.5,
  "deriv_score": 0.81,
  "onchain_score": 0.68,
  "whale_score": 0.73
}
When this score aligns with a strong ETF net inflow day, the probability of a sustained rally increases significantly. The ETF inflow indicator component is backed by direct monitoring of IBIT, FBTC, and the broader spot bitcoin ETF flows universe, ensuring that no major institutional move goes unnoticed.
Practical Workflow for Large Entries
A disciplined trader might set criteria like: (1) 3-day net flows > $800M, (2) Smart Money API composite > 0.65 with CONFIDENCE HIGH, and (3) price above the 21-day EMA. When all three align, the trader scales in with a size_mult suggested by the API. This framework removes emotional bias and keeps you in tune with the bitcoin ETF inflows price narrative that institutions themselves are following.
Macro Impact on ETF Demand
ETF flows do not exist in a vacuum. Macroeconomic conditions act as a throttle or brake on institutional Bitcoin demand. When real yields are falling and the DXY is weakening, capital rotates into risk assets, and spot bitcoin ETF inflows swell. Conversely, a hawkish Fed or a surging dollar often coincides with flat or negative ETF flows, even when on-chain signals are bullish.
Interest Rates and the Opportunity Cost
Bitcoin is a non-yielding asset, so when risk-free rates are above 5%, the hurdle for institutional allocation rises. Yet, in H2 2024, even with rates elevated, ETF inflows accelerated as the narrative shifted to a Fed pause and eventual cuts. This shows that forward-looking expectations matter more than current rates. Monitoring the CME FedWatch tool alongside ETF flow data can give you an edge in anticipating regime shifts.
Global Liquidity and Dollar Strength
Bitcoin has a well-documented correlation with global M2 money supply, and ETF flows amplify this relationship. As central banks inject liquidity, more capital finds its way into BTC via ETFs. A weaker dollar further boosts bitcoin’s appeal as a digital store of value. When you see ETF net flows breaking records while the DXY is declining, it’s a powerful multi-metric confirmation of a risk-on environment—exactly the type of confluence the Smart Money API’s composite scoring captures.
Geopolitical Shocks and Safe-Haven Flows
Interestingly, some geopolitical events have triggered short-term ETF outflows (as part of a broad de-risking), followed by sharp inflows as bitcoin is rediscovered as a non-sovereign asset. The Middle Eastern tensions in October 2024 caused a quick 5% drop and $400M in outflows, but within two weeks, flows turned positive and hit new highs. These whipsaws underscore the importance of measuring both flow magnitude and speed.
Putting It All Together: Your Institutional Edge
The bitcoin ETF inflows price signal is no longer just an academic idea—it’s a live, quantifiable metric that directly moves markets. By tracking spot ETF flows, you de-anonymize the actions of the world’s largest capital allocators. When you see IBIT and FBTC flows surging alongside a Smart Money API HIGH confirmation, you are not guessing; you are aligning with a data-backed edge that has a proven track record.
The institutional demand wave is still building. Pension funds, sovereign wealth funds, and corporate treasuries are only beginning their exploration of bitcoin via ETFs. The next phase of adoption will make today’s flow records look small, and those who master the art of reading these signals now will be positioned to capitalize. Don’t trade blind—get your free API key and start integrating ETF flow intelligence into your process today. Sign up for Smart Money API now and receive your free tier access to the composite confirmation engine, including the ETF tracker dashboard that thousands of traders rely on.