What Is the COT Report?
Origins and Purpose
The COT report bitcoin futures (Commitments of Traders) is a weekly publication by the Commodity Futures Trading Commission (CFTC Commitment of Traders) that breaks down aggregate futures positions held by different trader categories. Originally designed for agricultural commodities in the 1920s, the COT report has become a cornerstone for traders across all asset classes—including Bitcoin—seeking to understand who is driving price and with what conviction.
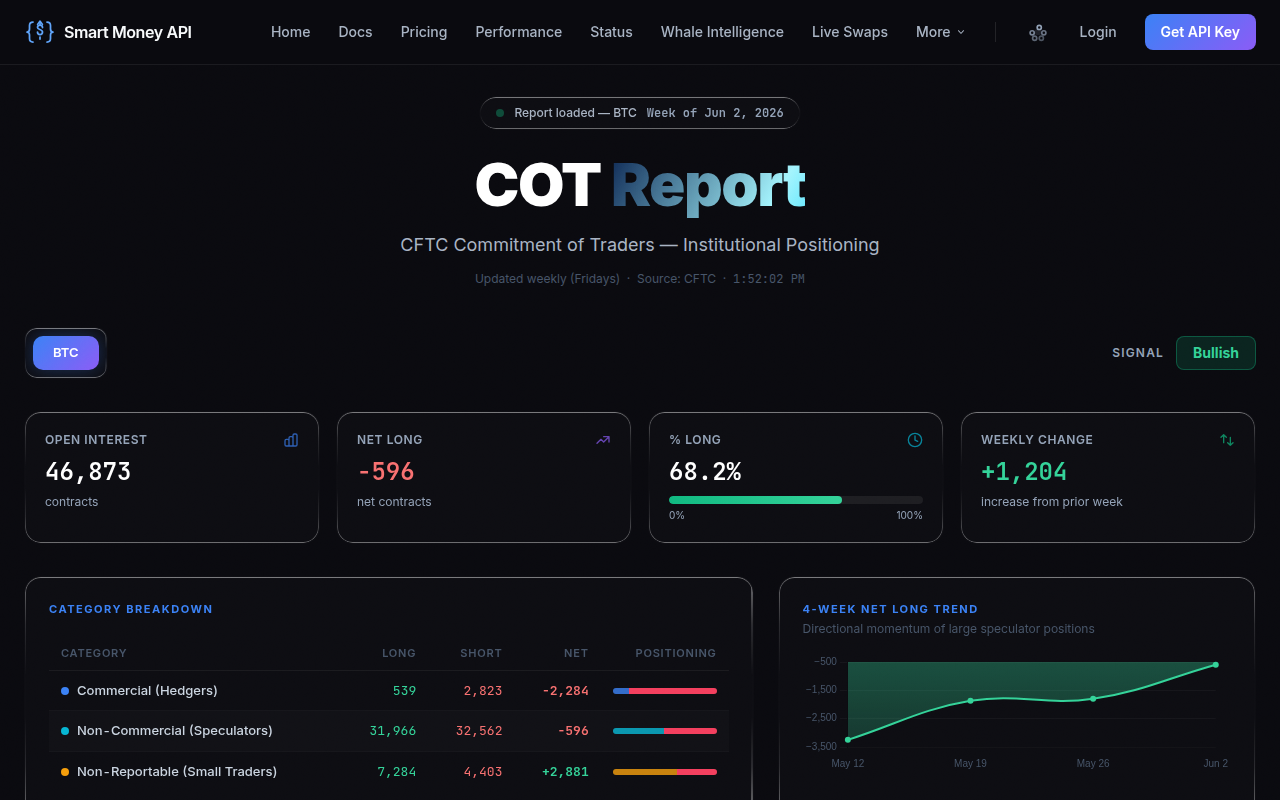
At its core, the report reveals the net long or short positioning of three broad groups: commercial traders (hedgers), non-commercial traders (large speculators), and non-reportable traders (small retail). In the crypto world, the CME Bitcoin futures contract (ticker: BTC) offers a regulated window into institutional flow. Unlike spot-only exchanges, the CME’s transparency mandate forces professional funds to report their positions, making bitcoin futures COT a rare, verifiable data stream in an often opaque market.
The CME Group and Bitcoin Futures
The Chicago Mercantile Exchange (CME) launched its Bitcoin futures in December 2017, exactly at the peak of that cycle’s mania. Since then, open interest has grown from a few thousand contracts to regularly exceeding 10,000 contracts (each representing 5 BTC). Because the CME is a CFTC-regulated Designated Contract Market, its traders are subject to position reporting thresholds. This data feeds into the COT sentiment indicator, giving crypto-native traders a direct read on how traditional finance is playing Bitcoin.
Why It Matters for Crypto Traders
Bitcoin’s volatile historical cycles often correlate with extreme positioning by speculative traders. By tracking the smart money positioning—generally the commercial or "hedger" category—you can identify periods when the crowd is overly bullish or bearish, historically a powerful contrarian signal. This article will show you how to interpret these signals and integrate them into a disciplined trading workflow, leveraging tools like the Smart Money API COT dashboard that fuses derivatives, on-chain, whale wallet data, and macro sentiment into a single trade-confirmation score.
Commercial vs Non-Commercial Traders
Defining Commercials (Hedgers)
In traditional commodities, commercials are the producers and consumers hedging against price fluctuations. In the Bitcoin futures market, the classification gets murkier. The CFTC defines a commercial trader as one that uses the futures contract for hedging purposes related to its business. For Bitcoin, this often includes miners locking in selling prices, exchanges or market makers hedging inventory, and increasingly, Bitcoin ETF issuers managing their creation/redemption baskets.
Despite the name, commercials are not necessarily “dumb money.” In fact, many sophisticated funds register as commercials to avoid speculative position limits. This means the smart money positioning we want to track may actually reside in this category, especially in Bitcoin. Over time, commercials have shown a remarkable ability to buy near cycle bottoms and reduce longs near tops.
Defining Non-Commercials (Speculators)
Non-commercial traders are the large speculators—hedge funds, commodity trading advisors (CTAs), and institutional trend-followers—that are not directly involved in the underlying Bitcoin business. They trade purely for profit. The CFTC breaks them out because their activity is considered a barometer of speculative sentiment. When net long positions by non-commercials hit extreme levels, it often signals a crowded trade and impending reversal. This is the crowd you want to fade at extremes.
Smart Money: Who Is Really "Smart"?
Conventional wisdom says fade the speculators and follow the commercials. In crypto, however, the lines blur. A more reliable methodology treats the entire COT landscape as a sentiment gauge, comparing current positioning to historical extremes across both categories. The COT sentiment indicator from the Smart Money API, for example, distills the positioning of commercials, non-commercials, and even non-reportable traders into a unified score, highlighting when all three classes align in a contrarian signal. The API’s bitcoin futures COT module lets you skip manual data mining and see at a glance whether the market is screaming “overbought” or “oversold” by institutional standards.
Smart Money Skew Analysis
Calculating the Skew
The simplest way to parse the COT report bitcoin futures data is to calculate the net position skew for commercials and non-commercials. For any given week:
- Commercial net position = Commercial long contracts – Commercial short contracts
- Non-commercial net position = Non-commercial long – Non-commercial short
Because commercials are structurally short hedging, their net position is almost always negative (net short). What matters is the magnitude relative to history. When commercials become less net short (i.e., their net short position shrinks dramatically), it suggests they are reducing hedges and turning bullish. Conversely, when non-commercial net long reaches a multi-year extreme, the market is dangerously one-sided.
Interpreting Net Long/Short Ratios
Smart money skew analysis goes beyond raw net numbers by tracking the rate of change. A weekly swing in commercial net position of more than 1,000 contracts (5,000 BTC) often precedes a trend change. For instance, in early 2023, commercials abruptly cut their net short from -2,500 contracts to -800 contracts in a matter of weeks—precisely as Bitcoin bottomed near $16,000. Tools like the Smart Money API automate this analysis by computing a composite score from derivatives flow (COT data), on-chain metrics, and whale wallet movements, delivering a clear “CONFIRM” or “CAUTION” signal.
Historical Skew Patterns
Since 2018, Bitcoin has experienced at least five distinct episodes where non-commercial net longs exceeded +2,500 contracts—each corresponding to a local or cycle top within 4-6 weeks. Similarly, commercial net shorts plummeting below -3,000 contracts have marked the end of major corrections. Recognizing these patterns turns the COT sentiment indicator into a practical timing tool, not just a theoretical curiosity.
Extreme Long Positioning Signals
When Speculators Are Overly Bullish
Extreme net long positions by non-commercial traders signal that the market has priced in all bullish narratives and is vulnerable to a liquidation cascade. The COT report doesn’t tell you the exact day of the top, but it consistently warns when the risk-reward for longs has deteriorated. A net long reading above the 90th percentile of the two-year range is a flashing red light.
Case Studies: Cycle Tops
Consider three recent tops:
- April 2021 ($64,900): Non-commercial net longs hit a record +3,200 contracts two weeks before the blow-off top and subsequent 50% crash.
- November 2021 ($69,000): Net longs peaked at +2,900 contracts just as the first ETF futures launched—a classic “buy the rumor, sell the news” setup signaled by extreme positioning.
- March 2024 ($73,800): In the run-up to the all-time high, non-commercial net longs surged to +3,100 contracts, the highest since 2021. The correction that followed shaved 15% off Bitcoin in a week.
In each case, traders who monitored the bitcoin futures COT and recognized extreme speculative exuberance were able to prepare for sharp reversals, using position calculators like CryptoCalcs’ advanced position calculator to size their stops and targets appropriately.
Extreme Short Positioning Signals
When Speculators Are Overly Bearish
Just as excessive net longs mark tops, extreme net shorts by large speculators mark bottoms. When non-commercials are heavily net short, it means the “big money” has already sold, and the market is likely dominated by capitulated retail. This is the fuel for a short squeeze. In the COT data, a net short position beyond the 5th percentile of the historical range is a powerful contrarian buy signal.
Case Studies: Bottoms
History shows that commercial traders accumulate while speculators panic. Examples:
- December 2018 ($3,200): Non-commercial net short hit -1,800 contracts, an all-time extreme. Commercials simultaneously reduced their net short by 40%. Bitcoin then rallied 330% over the next six months.
- March 2020 ($3,800): The COVID crash saw non-commercial net short spike to -2,100 contracts. Within two weeks, commercials had flipped to near-neutral, and Bitcoin entered a 20-month bull run.
- November 2022 ($15,500): Post-FTX meltdown, net speculative shorts swelled to -2,400 contracts. The subsequent rally to $31,000 by April 2023 rewarded those who read the COT tea leaves.
At these inflection points, the smart money positioning pattern is clear: commercials lean against the wind, fading the speculative crowd. A service like Smart Money API aggregates multiple data streams—COT, whale, on-chain—so you don’t have to manually correlate each bottom pattern. For instance, during the November 2022 bottom, the API returned a “HIGH” confidence composite score of 0.74, confirming the long setup.
How to Read CME Bitcoin COT
Reading the Official CFTC Report
The raw COT report is a text file released on Fridays at 3:30 PM Eastern. For Bitcoin, look under the “CME BITCOIN FUTURES” header. The layout can be intimidating, but the key sections are “COMMERCIAL” (code 4/8) and “NON-COMMERCIAL” (code 4/1). You’ll see columns labelled “LONG”, “SHORT”, and “SPREADING”. The net position is simply longs minus shorts.
Key Columns: Long, Short, Spreads
| Trader Category | Long Contracts | Short Contracts | Spread Contracts | Net Position |
|---|---|---|---|---|
| Commercial | 1,200 | 3,100 | 400 | -1,900 |
| Non-Commercial | 3,500 | 600 | 200 | +2,900 |
| Non-Reportable | 900 | 1,200 | 50 | -300 |
The table above is a stylised example of a top-heavy market: non-commercials are overwhelmingly net long (+2,900), commercials net short (-1,900). This asymmetric positioning would trigger caution from any COT sentiment indicator. Spreads (offsetting long and short positions in different contract months) are often ignored for directional analysis but can provide additional color on market structure.
Practical Example with Smart Money API
Instead of manually parsing the CFTC text file each Friday, traders can benefit from an API that standardizes and enriches the data. Consider the following real API response from the Smart Money API, which confirms a long BTC trade by blending COT derivatives data with on-chain and whale scores:
GET /v1/confirm?symbol=BTC&direction=long
{
  "composite": 0.74,
  "confidence": "HIGH",
  "action": "CONFIRM",
  "size_mult": 1.5,
  "deriv_score": 0.81,
  "onchain_score": 0.68,
  "whale_score": 0.73
}
Here, the deriv_score (0.81) incorporates COT data and other futures metrics, flagging strong institutional alignment. This approach transforms a raw CFTC Commitment of Traders report into an actionable signal, complete with a suggested trade size multiplier based on confidence level.
Release Schedule & Data Lag
Weekly Release Cycle
The COT report is published every Friday at 3:30 PM Eastern Time, covering positions held as of the preceding Tuesday’s market close. For Bitcoin traders, this means the data is already three days old at release. This inherent lag is the number one criticism of COT-based trading, but it matters less than you might think for a weekly/monthly timeframe.
The Tuesday Snapshot, Friday Release
Since Bitcoin trades 24/7, a lot can happen between Tuesday and Friday. A sudden 10% move might not be reflected in the report until the following week. However, institutional positioning changes slowly. Hedge funds don’t flip from massive long to short in two days without a deep structural shift. The bitcoin futures COT is a coarse-grained indicator best used for swing or position trading, not intraday scalping.
Why the Lag Matters and How to Adjust
You can mitigate the lag by cross-referencing the COT signal with faster indicators—exchange order book depth, funding rates, or whale alerts. This is precisely why a composite service like Smart Money API adds value: it combines the slow-moving COT signal with real-time on-chain metrics and whale transaction data to produce a composite confidence score. If the COT says extreme longs but on-chain shows distribution, the API’s onchain_score will be weak, lowering the composite and urging caution. The lag becomes a feature, not a bug, when fused with other data streams.
Combining COT with Price Action
Confirming Divergences
The most reliable COT-based setups emerge when price makes a new high (or low) but speculative net positions fail to confirm. For example, if Bitcoin rallies to a new local high but non-commercial net longs are lower than at the previous peak, it’s a bearish divergence. This was the exact setup in June 2023, when price hit $31,000 but net longs were 30% below the April peak—a warning sign before a 20% pullback.
Using COT as a Filter
Rather than taking every technical breakout at face value, you can filter signals through the lens of the COT sentiment indicator. A bullish MACD cross while non-commercials are already heavily net long? Low probability. A golden cross with commercials aggressively covering shorts? That’s a higher-conviction entry. Pairing this with a disciplined risk management tool, such as the CryptoCalcs advanced position calculator, helps you align position size with the strength of the COT signal.
Integrating with Other Indicators
The COT report works best as part of a broader framework:
- Identify extreme positioning via the COT (weekly).
- Confirm with on-chain metrics like exchange netflows and MVRV.
- Pinpoint an entry using price action or reduced tick timeframes.
- Manage risk with a tool that computes position size based on account equity and stop distance.
This layered approach turns the COT report bitcoin futures from a lagging academic exercise into a practical edge. For those who prefer a turnkey solution, the Smart Money API quantifies all these layers into a single composite, with a proven 62% win rate on HIGH-confidence signals—offering a free tier to get started.
Conclusion: Turn COT Data Into a Trading Edge
The CFTC Commitment of Traders report for Bitcoin futures is one of the only transparent portholes into institutional positioning. By monitoring non-commercial traders for extremes and watching commercial traders for divergence, you can spot the kind of macro pivots that define crypto cycles—tops fueled by crowded longs and bottoms carved by extreme fear. But raw data can be overwhelming and stale. That’s why modern traders are turning to composite intelligence platforms that fuse COT with on-chain and whale data, delivering a single, actionable trade-confirmation score. If you’re ready to stop guessing and start tracking smart money positioning with institutional-grade clarity, claim your free API key at Smart Money API and integrate these COT insights directly into your trading system.