The Dollar Index (DXY) & Crypto Relationship
What Is the DXY?
The US Dollar Index (DXY) measures the greenback against a basket of six major currencies—euro, yen, pound, Canadian dollar, Swedish krona, and Swiss franc. It is the most widely watched benchmark of dollar strength. When the DXY rises, the dollar appreciates relative to its peers; when it falls, the dollar weakens. Because Bitcoin and many cryptocurrencies are quoted in dollars globally, DXY movements directly alter the purchasing power of non-USD investors and shift the opportunity cost of holding dollar-denominated risk assets.
Why DXY Moves Inversely to Bitcoin
The DXY bitcoin inverse correlation is one of the most persistent macro relationships in crypto. A stronger dollar typically tightens global financial conditions, reducing liquidity and risk appetite. Since Bitcoin is priced in dollars, a rising DXY makes Bitcoin more expensive for foreign buyers, dampening demand. Conversely, a declining dollar often coincides with loose monetary conditions, boosting capital flows into emerging markets, commodities, and crypto. The correlation isn't perfect, but it forms a foundational pillar of crypto macro indicators DXY yields analysis.
Quantifying the Correlation
Over rolling 90-day windows, the Pearson correlation between DXY and Bitcoin has frequently dipped to -0.7 or lower during trending macro regimes. This means the two move opposite each other about 70% of the time when macro forces dominate. However, during crypto-native events (such as exchange collapses or protocol upgrades), the correlation can break down. Still, understanding the baseline inverse relationship gives traders a significant edge when combining macro with on-chain or derivatives data.
Exceptions and Decoupling Events
While the inverse link holds over economic cycles, decoupling can occur during idiosyncratic crypto shocks. For example, during the COVID-19 crash in March 2020, both DXY and Bitcoin initially plunged together as liquidity seized, before Bitcoin recovered. Similarly, Bitcoin's 2021 rally to new highs happened alongside a stubbornly elevated dollar, driven by unique factors like institutional adoption. Spotting these exceptions requires blending macro with sentiment and flow indicators—exactly the type of composite analysis that modern trading intelligence platforms deliver.
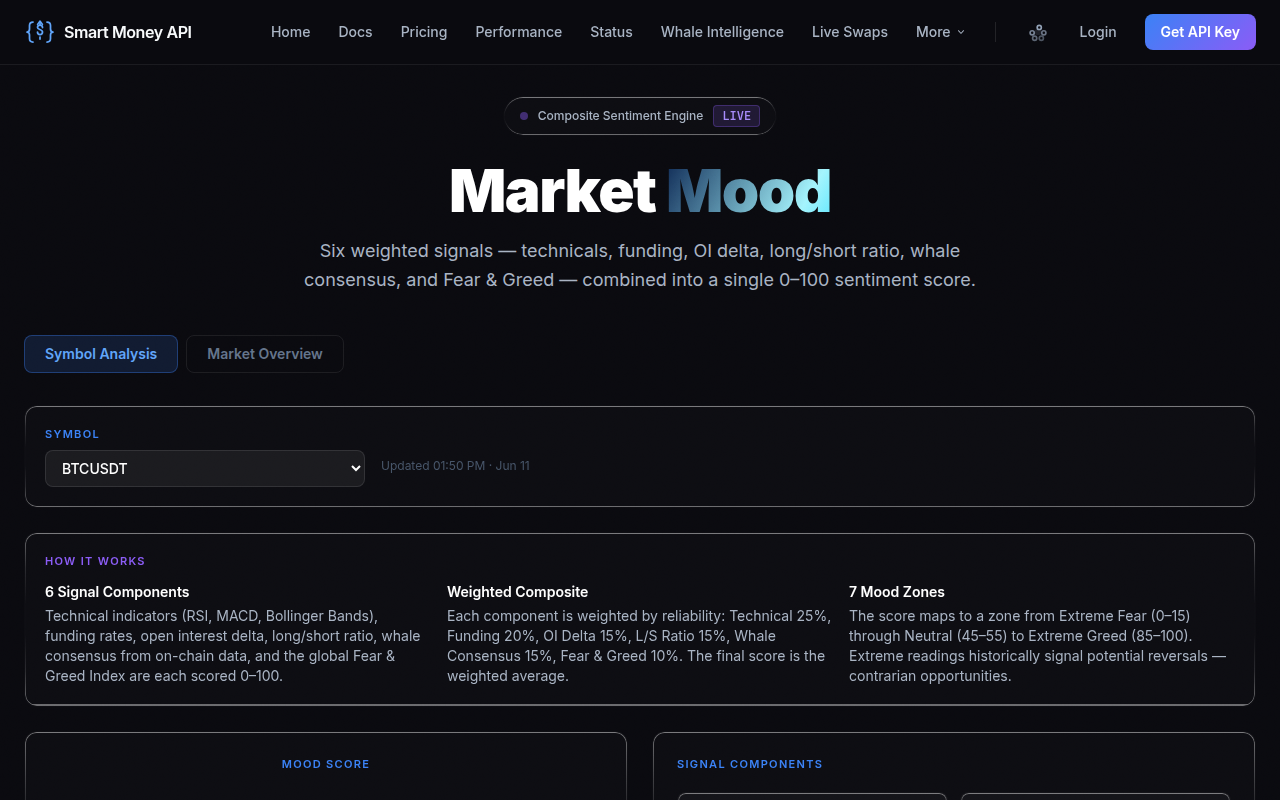
To harness these forces without manually juggling dozens of data streams, traders increasingly rely on composite scoring systems. For instance, the Smart Money API fuses derivatives, on-chain, whale wallet movements, and macro/news signals into a single trade-confirmation score. This kind of tool distills the messy macro picture into actionable confidence metrics.
Historical DXY Extremes & Crypto
Key DXY Peaks and Bitcoin Troughs
The DXY peaked near 114.8 in September 2022, a 20-year high. Bitcoin bottomed around $15,500 two months later. The record dollar strength, driven by aggressive Fed rate hikes, drained liquidity from risk assets. Similarly, the March 2020 COVID spike to 103 saw Bitcoin briefly crash below $4,000. These episodes underscore how DXY extremes act as reliable recessionary pressure gauges for crypto.
DXY Troughs and Bitcoin Peaks
Conversely, the DXY's multi-year bottom near 89 in early 2018 marked the tail end of a crypto winter; Bitcoin had peaked at $20,000 the previous December. In 2021, the dollar meandered near 90, allowing Bitcoin to surge to $69,000. The pattern: sustained dollar weakness usually accompanies the most explosive crypto bull runs, validating the bitcoin dollar index correlation as a timing tool.
Data Table: DXY Milestones vs BTC Price
| Date | DXY Level | Event | Bitcoin Price |
|---|---|---|---|
| Mar 2020 | 103.0 | COVID liquidity crisis | ~$3,800 |
| Jan 2021 | 89.2 | Post-pandemic stimulus low | ~$41,000 |
| Sep 2022 | 114.8 | Peak rate-hike fear | ~$19,000 |
| Nov 2022 | 113.0 | FTX aftermath | ~$15,500 |
| Jul 2024 | 103.5 | Resilient economy + hawkish repricing | ~$60,000* |
*Approximate contemporaneous levels; directional context.
US Treasury Yields & Risk Asset Flows
The Risk-Free Rate and Money Rotation
US Treasury yields represent the government's borrowing cost and serve as the global risk-free benchmark. When yields rise, bonds become more attractive relative to non-yielding and volatile assets like crypto, prompting a rotation from risk to safety. This treasury yield crypto impact is most pronounced at the long end: a surging 10-year yield can choke off speculative fervor. Conversely, falling yields often fuel crypto rallies as investors reach for yield and accept higher risk.
10-Year Yield as a Global Benchmark
The 10-year Treasury note yield feeds into mortgage rates, corporate borrowing costs, and equity valuations. Above 4%–5%, historically, risky assets face headwinds. In October 2023, the 10-year yield briefly touched 5%, triggering a sharp Bitcoin correction. Monitoring weekly closes relative to key levels helps crypto traders anticipate shifts in macro sentiment. A sustained break below 4% would be historically bullish for Bitcoin.
Yield Surges and Crypto Drawdowns
Rapid yield increases (30+ bps in a day) often correlate with intra-day crypto selloffs above 5%. This is because leveraged positions in derivatives markets get liquidated as hedging costs spike. The fed policy crypto channel works through expectations: traders front-run central bank moves, and yields are the most sensitive expression. When the Fed signals tighter policy, the 2-year yield jumps, and Bitcoin typically dips within hours.
Fed Policy Cycle & Bitcoin Rallies
Rate Hikes vs Rate Cuts: Historical Patterns
Bitcoin's two largest bull runs—2017 and 2020–2021—occurred during Fed easing cycles. The 2017 rally came as the Fed raised rates gradually from ultra-low levels, but quantitative easing was still abundant. The 2020–2021 explosion was fueled by emergency cuts to 0% and massive asset purchases. Conversely, the 2022 rate-hiking campaign, the fastest in decades, crushed crypto valuations. The lesson: fed policy crypto is the tide; it lifts or sinks all boats.
Quantitative Easing/Tightening Effects
Quantitative Easing (QE) expands central bank balance sheets, injecting liquidity that often finds its way into crypto. Quantitative Tightening (QT) drains it. Bitcoin's correlation with the Fed's balance sheet size has been remarkably strong. Each round of QE since 2020 coincided with a parabolic BTC move. As of 2025, the runoff continues, but markets are forward-looking; a pivot to slower QT or renewed QE would be the ultimate macro bullish signal.
Forward Guidance and Crypto Volatility
Fed meeting minutes, dot plots, and press conferences generate outsized crypto moves. Traders parse language like "transitory" or "restrictive" for clues. A single dovish sentence from the Chair can add 10% to Bitcoin in a day. This makes a macro trading calendar indispensable—knowing when FOMC decisions, minutes, and speeches occur allows you to position for or against volatility.
2-Year vs 10-Year Yield Spread
Understanding the Yield Curve
The 2-year note is most sensitive to Fed policy expectations; the 10-year reflects long-term growth and inflation views. The spread (10Y minus 2Y) is a classic recession indicator. When it inverts (2Y > 10Y), markets expect a downturn. This spread impacts crypto indirectly through its effect on risk appetite and credit conditions.
Inversion and Recession Signals
The yield curve inverted deepest in late 2023 at -1.08%, the most extreme since the 1980s. Historically, such inversions preceded recessions by 12–18 months. Bitcoin tended to bottom well before the recession officially began, as markets discounted the subsequent Fed pivot. Tracking the steepening of the curve from inverted levels can signal the next risk-on window for crypto.
Bitcoin's Response to Curve Dynamics
When the curve rapidly steepens due to a collapsing 2-year yield ("bull steepening"), Bitcoin often rallies as expectations shift to rate cuts. A "bear steepening" driven by rising long-end yields is more ambiguous. Monitoring the shape—flat, inverted, or positively sloped—adds nuance to macro trading signals.
Real Yields & Bitcoin Correlation
Defining Real Yields
Real yield = nominal yield minus expected inflation. It represents the actual compensation for forgoing consumption. A rising real yield increases the attractiveness of safe assets and raises the discount rate for future cash flows, hurting long-duration assets like tech stocks—and increasingly, Bitcoin. The correlation between 10-year TIPS real yield and Bitcoin has been strongly negative since 2022.
Inflation-Protected Securities (TIPS)
10-year TIPS yields moving above 2% in 2023 marked a regime shift: risk-free real returns competed directly with crypto's speculative allure. When real yields are high and rising, institutional allocators pull back from crypto. When they fall, the "there is no alternative" (TINA) psychology returns, boosting Bitcoin.
When Real Yields Bite
A real yield surge from -1% to +2% corresponded with a 60%+ Bitcoin drawdown in 2022. This relationship serves as a powerful crypto macro indicators DXY yields tool. Observing real yields weekly helps anticipate when macro pressure may overwhelm crypto's intrinsic narratives.
Geopolitical Shocks & Safe-Haven Flows
Flight to Safety Dynamics
Geopolitical turmoil (wars, sanctions, banking crises) triggers a scramble for dollars and Treasuries, pushing the DXY higher and yields lower. This classic flight to safety often initially hurts Bitcoin as liquidity flees. However, longer-term, if the dollar's weaponization erodes its reserve status, Bitcoin can benefit as a neutral digital gold.
Dollar as Haven vs Bitcoin as Digital Gold
During the 2022 Russia-Ukraine conflict, Bitcoin initially fell but then recovered as sanction fears drove non-Western demand. The 2023 US regional banking crisis saw Bitcoin rally sharply alongside gold while the DXY wobbled. These events revealed Bitcoin's evolving dual nature: risky asset in liquidity squeezes, but emerging safe haven against institutional fragility.
Case Studies from Recent Crises
In March 2023, the failure of Silicon Valley Bank triggered a 25% Bitcoin surge in two weeks, precisely as the DXY dropped from 105.7 to 101.0. The 2-year yield collapsed from over 5% to 3.7%. This was a textbook macro disinflation trade that lit up every macro trading signals dashboard. Conversely, the 2025 trade war escalations saw Bitcoin dip but then recover, driven by expectations of eventual Fed easing.
Building a Macro Trading Calendar
Key Releases and Central Bank Meetings
Every serious crypto macro trader tracks: FOMC decisions, CPI/PCE inflation reports, non-farm payrolls, ISM manufacturing, GDP, and weekly jobless claims. Also crucial are Treasury auction results and Fed minutes. These events often produce Bitcoin swings of 3–5% intraday. Mark them on a calendar and note consensus vs. actual to gauge market reaction.
Using Data Aggregators and APIs
Instead of manually collating data, tools like the advanced position calculator from CryptoCalcs help size positions based on conviction and volatility. For a real-time macro edge, APIs that fuse multiple signals are invaluable. Here's how the Smart Money API delivers a composite trade-confirmation score:
GET /v1/confirm?symbol=BTC&direction=long
{
  "composite": 0.74,
  "confidence": "HIGH",
  "action": "CONFIRM",
  "size_mult": 1.5,
  "deriv_score": 0.81,
  "onchain_score": 0.68,
  "whale_score": 0.73
}
This API response integrates macro indicators (reflected in the deriv_score and overall composite) alongside on-chain and whale activity. A HIGH confidence, long confirmation, with a 1.5x size multiplier, can be a powerful addition to your toolkit, especially when macro and crypto-native signals align.
Combining Macro with On-Chain & Derivatives
No single indicator is perfect. The sweet spot emerges when macro tailwinds (falling DXY, declining real yields) coincide with on-chain accumulation and bullish derivatives positioning. That's the exact logic behind composite scoring systems. By using the Smart Money API, traders can avoid analysis paralysis and act decisively when the crypto macro indicators DXY yields scream "risk-on."
Conclusion & Next Steps
Understanding crypto macro indicators DXY yields transforms you from a reactive trader into a strategic one. The dollar and Treasury yields do not just correlate with crypto; they govern the liquidity tides that determine bull and bear cycles. Integrating real yields, the yield curve, and Fed policy into your process—alongside technical and on-chain tools—gives you a colossal edge. To move from insight to action, start leveraging institutional-grade signals today. Get your free API key and see how macro, derivatives, whales, and on-chain data form one clear, high-conviction signal. The smart money already reads the macro tea leaves—now you can too.