Options Basics: Calls, Puts, OI, IV
Before diving into crypto options flow analysis, you must understand the raw materials. Think of calls and puts not as bets on direction but as building blocks for far more sophisticated positioning. A call gives the holder the right (not obligation) to buy the underlying asset at a set strike price before expiry; a put gives the right to sell. When institutions buy a call, they expect upside. But they rarely do so naked—they might simultaneously sell a different call or put, creating spreads, straddles, or risk reversals that reveal their true intention.
The Building Blocks of Options Flow
Open Interest (OI) counts all outstanding contracts for a given strike and expiry. It's a snapshot of capital committed. Volume, on the other hand, tells you how many contracts traded in a session. The real signal lies in the delta between the two. When volume spikes but OI also rises, it means new money is entering the market—not just existing positions being closed. Implied Volatility (IV) is the market's forecast of future turbulence, baked into an option's price. High IV means expensive protection, often coinciding with fear or expected events. Smart money uses IV extremes to sell premium when retail is panicking or to buy cheap hedges before volatility erupts.
Why Options Data Matters More Than Price
Spot price tells you what happened; options flow hints at what will happen. Because institutional traders, market makers, and whales often structure their positions in the options market first, you can spot accumulation or distribution weeks before it shows on the chart. For instance, if a trader wants to buy 5,000 BTC without impacting the spot order book, they might sell out-of-the-money puts to get paid while waiting, or buy deep-in-the-money calls that dealers must delta-hedge by purchasing spot. The resulting flow leaves fingerprints: OI spikes at specific strikes, shifts in the put/call ratio, or growing gamma exposure.
Open Interest vs. Volume: Spotting Fresh Inflows
Distinguishing fresh capital from closing trades is the cornerstone of any options flow indicator. Use OI change alongside volume. For example, if BTC's $70,000 call sees 10,000 contracts traded and OI grows by 9,500, that's massive new bullish positioning. Conversely, if volume is high but OI drops, it's likely profit-taking or stop-outs. This data is central to tools like the Smart Money API options flow dashboard, which scans across strikes and expiries to flag unusual activity. With one endpoint, you can confirm whether a move is institutionally backed:
GET /v1/confirm?symbol=BTC&direction=long
{
  "composite": 0.74,
  "confidence": "HIGH",
  "action": "CONFIRM",
  "size_mult": 1.5,
  "deriv_score": 0.81,
  "onchain_score": 0.68,
  "whale_score": 0.73
}
This composite fuses derivatives, on-chain data, and whale wallet activity into a single confirmation score—a modern smart money options signal.
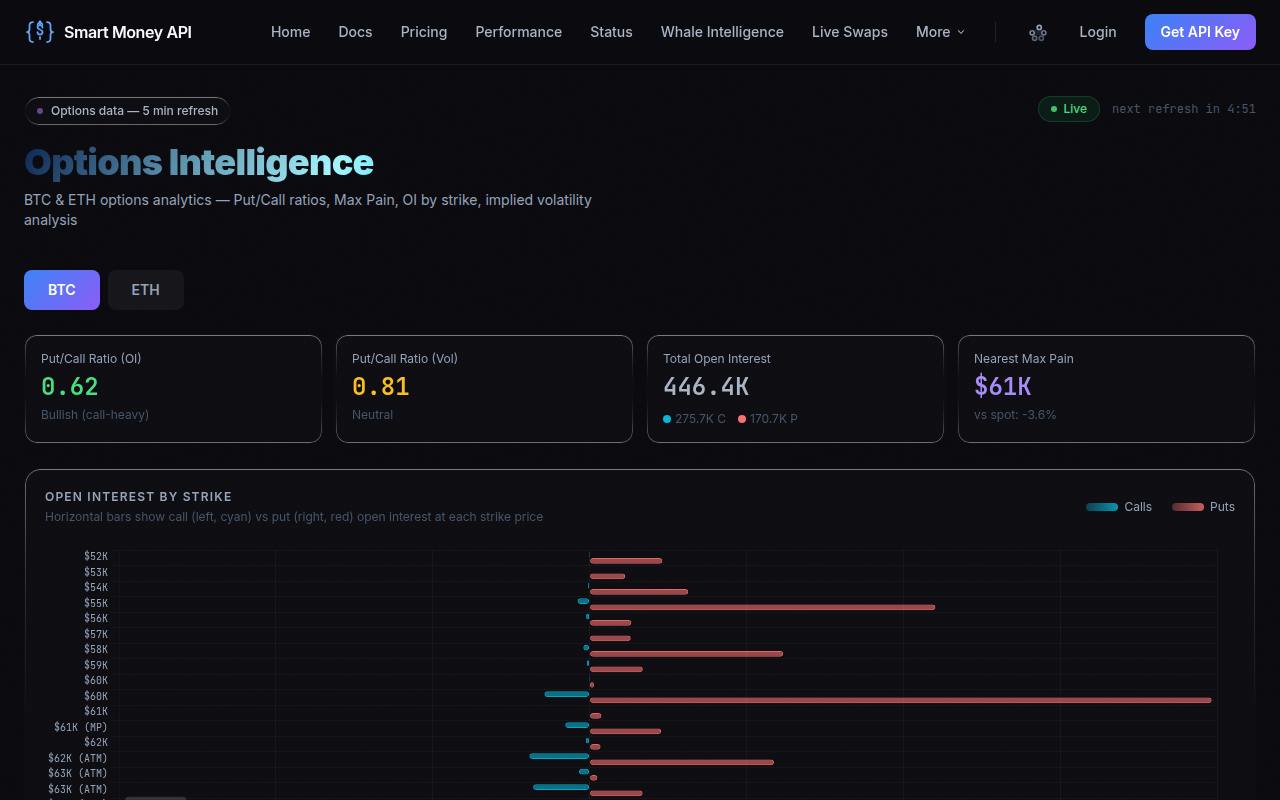
Put/Call Ratio as Sentiment Gauge
The put/call ratio (PCR) is the classic barometer of market mood, but interpreting it requires nuance. In crypto options, the PCR is calculated by dividing the total put open interest (or volume) by total call open interest. A ratio above 1.0 suggests puts dominate—typically a bearish or fearful signal. Below 0.7, calls are in majority—greed or bullish conviction. Yet extreme readings often act as contrary indicators.
Calculating the PCR: Simple Ratio, Complex Story
Most platforms allow you to slice PCR by expiry, strike range, or execution type (buy vs. sell). A put call ratio crypto trader should monitor both volume-based and OI-based ratios. Volume PCR tells you today's sentiment; OI PCR tells you the accumulated stance. For example, a spike in volume PCR to 1.8 while OI PCR stays at 1.0 suggests a brief panic that hasn't changed the overall structure—a potential buying opportunity. Conversely, a steadily rising OI PCR over weeks indicates genuine shift to defensive positioning.
Interpreting Extremes: When Fear or Greed Overwhelm
When the volume PCR catapults above 2.0, especially during a sell-off, it often marks a local bottom because everyone who wanted to hedge already did. The same works inversely: a PCR below 0.4 can signal euphoria ripe for a correction. However, in crypto, persistent low PCRs have coincided with extended bull runs as institutions overwrite calls or sell puts to generate yield. Context is everything—use skew and IV term structure to validate.
PCR Across Expiries: Short-Term Panic vs. Long-Term Positioning
The shape of PCR across expiry dates reveals whether fear is immediate or distant. If the weekly options show a 2.5 PCR while the monthly sits at 0.8, it's likely a short-lived event (e.g., Fed meeting) being hedged, not a directional bet on a sustained drop. Many successful traders use the Smart Money API to get a composite view that combines this options flow with on-chain accumulation scores, avoiding false signals from temporary hedging flows.
Open Interest Spikes & New Positioning
An options open interest signal is among the most powerful predictors because it represents new capital backing a specific price thesis. When OI balloons at a particular strike, it draws the price like a magnet due to dealer hedging dynamics.
Sudden OI Surges: Following the New Money
Imagine BTC at $65,000. Over 48 hours, OI at the $80,000 call strike doubles from 2,000 to 5,000 contracts with corresponding volume. That's not a retail frenzy—it's likely a single institution or a coordinated group building a large position. This could be a speculative bet on a breakout, or a hedge against a short position. Following this new money means monitoring the same flow: increased OI at $75,000, then $80,000 repeatedly. Such clustering often precedes a rapid rally as dealers buy spot to hedge their short call exposure (gamma effect).
Gamma Squeeze Potential: When Dealers Must Hedge
When a large number of out-of-the-money calls are purchased, market makers sitting on the other side sell those calls and are short gamma. As the spot price rises towards the strike, they must buy more spot to remain delta-neutral, accelerating the up move. This is a gamma squeeze. You can detect it by tracking OI build-up at the nearest upside strikes relative to spot. An options flow dashboard that highlights unusual gamma accumulation, like the Smart Money API, can alert you before the move gains momentum. It might show a size_mult of 1.8, meaning the trade is 80% larger than the typical whale activity, raising a CONFIRM action for a long position.
Using OI to Confirm Breakouts and Breakdowns
A breakout with no accompanying OI growth is suspect. If BTC pushes through resistance at $68,000 but call OI at $70,000 remains flat or decreases, the rally may lack conviction. Conversely, a breakdown supported by massive put OI additions at the next support level indicates institutions are bracing for (or causing) further downside. After confirming your thesis with options flow, you can refine entry and size using tools like the advanced position calculator to manage risk based on expected volatility.
Strike Clustering & Price Targets
Options traders don't just bet on direction—they set price targets. The clustering of open interest at specific strikes acts as a market-generated range forecast. By reading these cluster maps, you can identify where large players expect the market to go and where they intend to defend their positions.
Max Pain: The Market's Compass?
Max pain is the strike price where the total value of all in-the-money options would be minimized for option sellers. In theory, market makers manipulate price towards this level at expiry to extract maximum value. While debatable in crypto's decentralized markets, max pain often acts as a strong anchor—especially on monthly expiries. When BTC trades above max pain, you might see a slow gravitation downward into the expiry unless spot momentum overrides. Combining max pain with OI concentration gives you a powerful options flow indicator for short-term range trading.
Strike Walls as Support and Resistance
Strikes with extremely high OI form "walls" that act as support or resistance. For example, if BTC has 8,000 call contracts at $72,000, that strike becomes a ceiling because dealers will sell spot as the price approaches to hedge their short gamma, and they may push aggressively to let those calls expire worthless. Likewise, a massive put wall at $58,000 provides a cushion: as BTC drops, dealers buy spot to hedge short puts, helping to stabilize the price. Spotting these walls via an options open interest signal lets you anticipate reversals and target exits.
How Whales Set the Range
Whales often sell strangles—shorting both an out-of-the-money call and put—to earn premium while defining a range they expect the market to hold. When you see sharp OI increases at a lower put strike and a higher call strike simultaneously, it's a range-bound bet. Smart Money API's composite score can help detect whether that range is likely to hold by cross-referencing on-chain accumulation and whale wallet activity. If the API's confidence is LOW despite the strangle, the market might break out.
Risk Reversals & Skew Signals
Risk reversals and skew are the sophisticated trader's early warning system. They measure the relative cost of puts versus calls, stripping out time premium to reveal directional fear or greed. A risk reversal is simply a long OTM call combined with a short OTM put (or vice versa), and its pricing reflects the market's skew.
What a Risk Reversal Tells You
A positive 25-delta risk reversal (calls more expensive than puts) signals bullish bias; negative signals bearish protection demand. If the risk reversal rises from -5 to -3, the market is becoming less fearful—often a precursor to a rally. When it flips positive, that's a strong smart money options signal that institutions are pricing upside breakout risk. You can track risk reversals across expiries on many options analytics platforms; dedicated APIs like Smart Money API incorporate this into their derivative score.
Skew as a Leading Indicator for Rallies and Crashes
Put-call skew compares the IV of out-of-the-money puts to at-the-money options. Traditionally, a steep put skew (puts very expensive) indicates fear and can precede a bounce, as the market is already braced for the worst. But persistent skew elevation might also warn of a genuine tail risk event. In crypto, skew can invert—call skew rises above put skew—during bull frenzies, signaling overheating. The key is monitoring changes in skew: a flattening skew after a period of high put skew is a bull signal; a sudden steepening from flat indicates hedging ahead of a potential dump.
Reading the 25-Delta Skew
Use the 25-delta skew (the difference in IV between a call and put at the 25-delta level) as a standardized metric. A consistent rise suggests call demand increasing relative to puts. When the 25-delta skew crosses above zero and continues to trend higher, momentum strategies often kick in, reinforcing the trend. Combine this with the composite confirmation from Smart Money API to avoid false breakouts: if skew flips positive but the API's onchain_score remains weak, the rally might lack genuine accumulation.
Implied Volatility Extremes
Volatility is its own asset class. Options implied volatility extremes offer some of the most reliable mean-reversion signals in crypto. Because option premiums are directly tied to IV, traders who can identify when IV is statistically too high or too low have an edge.
Term Structure: When Contango Signals Fear
The IV term structure plots IV across expiries. In calm markets, longer-dated options have higher IV (contango) to account for time risk. When near-dated IV spikes above longer-dated—an inverted structure or backwardation—it signals acute, immediate fear. This often coincides with a market bottom. Conversely, if the term structure is steeply upward with low near-term IV, it's complacency, and crashes can be violent. Smart money uses options flow to identify when term structure inverts, then buys spot or sells puts as IV collapses.
IV Rank and Percentile: Context is Everything
IV Rank tells you where current IV stands relative to its range over a given period (e.g., 52-week high-low). A high IV rank (>70) means options are expensive; you might favor selling strategies. A low IV rank (<30) means options are cheap; you might buy calls or straddles ahead of expected volatility. Pair this with the options flow indicator: if IV rank is high and put volume is surging, it might be a hedge against a real event, not a contra-trade. The Smart Money API's composite score integrates this by weighing derivatives activity against on-chain flows, helping you distinguish between false hedges and genuine smart money repositioning.
Volatility Crush After Events
Post-announcement volatility crush is a classic. IV runs up into a known event (ETF decision, halving, macro data) and collapses after the news releases, regardless of direction. The options flow ahead of such events reveals who is overpaying for protection. If you see enormous call buying at elevated IV but the API's whale_score remains neutral, it's likely retail FOMO, and you can sell volatility or set up a delta-neutral strategy. After the crush, IV often rebounds from very low levels, offering buying opportunities for the next leg.
Institutional Hedging Patterns
Institutions manage risk with large, recurring patterns that leave distinct marks on the order book. Recognizing these smart money options hedges allows you to position alongside or in front of them.
Protective Puts and Collars: Spotting Downside Protection
When a fund wants to protect a large BTC holding, it buys puts or sets up a collar (buying a put, selling a call to finance it). This manifests as massive put OI additions at a strike 10–20% below spot, sometimes accompanied by call sales at an upper strike. If you see a flurry of put buying at $55,000 when spot is $65,000, expect that level to act as a hard floor. Smart Money API often detects such activity because it tracks whale wallets that interact with those options—raising the whale_score and pushing a composite HIGH confidence signal.
Overwriting for Yield: When Smart Money Sells Volatility
Many crypto funds overwrite: they hold spot and sell out-of-the-money calls to generate yield. This results in a consistent build-up of call OI at higher strikes, suppressing volatility and creating a ceiling. A trader can profit by selling those calls themselves or timing when the overwriting gets pulled (call OI drops) as the market surges through the resistance. The API's deriv_score often spikes when such supply-side pressure abates, signaling a potential breakout.
Block Trades and Dark Pool Prints in Options
Large block trades—typically negotiated off-screen and then printed—reveal institutional intentions. A single block of 1,000 BTC-equivalent puts bought at the bid likely is protective; 1,000 calls bought at the ask could be speculative. Monitoring options block flow via services like Smart Money API gives you real-time alerts. For example, the API might return a CONFIRM action with size_mult 2.0, telling you that a trade is twice the average whale size and worth following.
Predicting Volatility Events with Options
Options flow doesn't just reflect current sentiment—it can foretell specific volatility explosions. Gamma exposure, vega positioning, and dealer hedging requirements create self-fulfilling prophecies.
Gamma Exposure Maps: The Next Liquidity Avalanche
Gamma exposure (GEX) measures the sensitivity of market makers' delta hedges to price changes. When GEX is highly positive (many outstanding calls), dealers dampen volatility as they buy dips and sell rallies to stay delta-neutral. But when price moves outside the concentrated strike cluster, GEX flips negative or calls become unhedged, dealers must chase the move, causing a volatility avalanche. By analyzing the GEX profile derived from OI, you can pinpoint the levels where price will accelerate. This is one reason the Smart Money API's composite score includes a derivative component—it quantifies this risk.
Options Flow as a Leading Indicator of Breakouts
Breakouts are often preceded by a decline in OI at the money and a build-up in OTM calls or puts, shrinking the dealer's hedging range and tightening the spring. When you combine that with a rising options implied volatility skew and an uptick in whale transactions, the signal is potent. The Smart Money API delivers a single composite score that merges these insights, with a 62% win rate on HIGH signals. By confirming with on-chain accumulation and macro news sentiment, you avoid the noise that pure options flow analysis can sometimes generate.
| Signal Component | What It Measures | Interpretation Example |
|---|---|---|
| Put/Call OI Ratio | Accumulated directional bias | Ratio >1.2 persistently: institutional hedging |
| IV Rank (30-day) | Volatility context vs. recent history | Rank >80: options expensive; consider selling |
| 25-Delta Skew | Put vs. call premium imbalance | Skew crossing below -5 to -2: bearish fear easing |
| GEX Profile | Dealer hedging pressure points | Positive GEX at $70K defends that level |
| Whale Wallet Activity | Large entity accumulation/distribution | Sudden whale buys + call OI spike = breakout |
This table illustrates how a comprehensive crypto options flow analysis synthesizes multiple data points. Relying on one metric often leads to whipsaws. The Smart Money API brings these together with the on-chain and macro layer, outputting a trade-confirmation score that helps you time entries and exits with greater confidence.
Start Trading with Institutional-Level Options Data
Mastering crypto options flow analysis transforms you from a retail trader reacting to price into an informed speculator anticipating institutional moves. By tracking OI spikes, put/call ratio shifts, skew, and gamma profiles, you gain a front-row seat to the chess match between whales, market makers, and hedgers. But sifting through this data manually is daunting. That's where the Smart Money API becomes invaluable—it fuses derivatives flow with on-chain analytics, whale wallets, and macro sentiment into a composite score that tells you whether the smart money is accumulating or distributing. With a 62% win rate on HIGH confidence signals and a free tier to get started, there's no excuse to trade blind. Claim your free API key today and start reading the bets before the moves.