What Is the Fear & Greed Index?
The Crypto Fear & Greed Index is a sentiment oscillator that gauges the two dominant emotions driving market participants: fear and greed. Originally popularized by CNN Money for the stock market, the concept was adapted for cryptocurrencies by Alternative.me to help traders determine whether the market is irrationally pessimistic or overly euphoric. The index ranges from 0 (Extreme Fear) to 100 (Extreme Greed), with a midpoint at 50 representing a neutral mood.
Contrarian traders view extreme readings as opportunistic signals. When the needle plunges below 25, fear has likely reached a point of exhaustion, making it a strategic buying zone. Conversely, when the index climbs above 75, euphoria may be unsustainable, signaling an impending correction. However, raw sentiment alone can be misleading without additional confirmation, as extreme fear can persist for weeks during a prolonged downtrend. This is why sophisticated traders pair the Fear & Greed Index with on-chain analytics and derivatives data—like those offered by the Smart Money API—to build a robust contrarian framework.
Understanding this psychological gauge is the first step toward fading the crowd. In this article, we'll dissect the index's calculation, examine real historical extremes, and construct a repeatable contrarian strategy that combines sentiment with hard data.
How Is It Calculated?
Alternative.me computes the daily Crypto Fear & Greed Index by aggregating five weighted inputs, each normalized and assigned 20% of the total weight. The components are:
- Volatility (25%): Measures the current and maximum drawdowns of Bitcoin, comparing them with historical averages. High volatility spikes often correlate with fear.
- Market Momentum/Volume (25%): Examines trading volumes and price momentum relative to the 30‑day and 90‑day averages. Falling volume and negative momentum push the index lower.
- Social Media (15%): Analyzes Reddit and Twitter (X) posts, tracking engagement rate, sentiment polarity, and number of mentions. A surge in bearish posts contributes to fear.
- Surveys (15%): Weekly poll results from a broad crypto audience, directly asking how investors feel about the market.
- Dominance (10%): Bitcoin's market cap as a percentage of the total crypto market. Rising dominance during a drawdown signals risk‑off sentiment (fear), while falling dominance suggests risk‑on greed as capital flows to altcoins.
- Trends (10%): Google Trends data for crypto‑related search terms. Spikes in "bitcoin crash" or "sell crypto" increase fear readings.
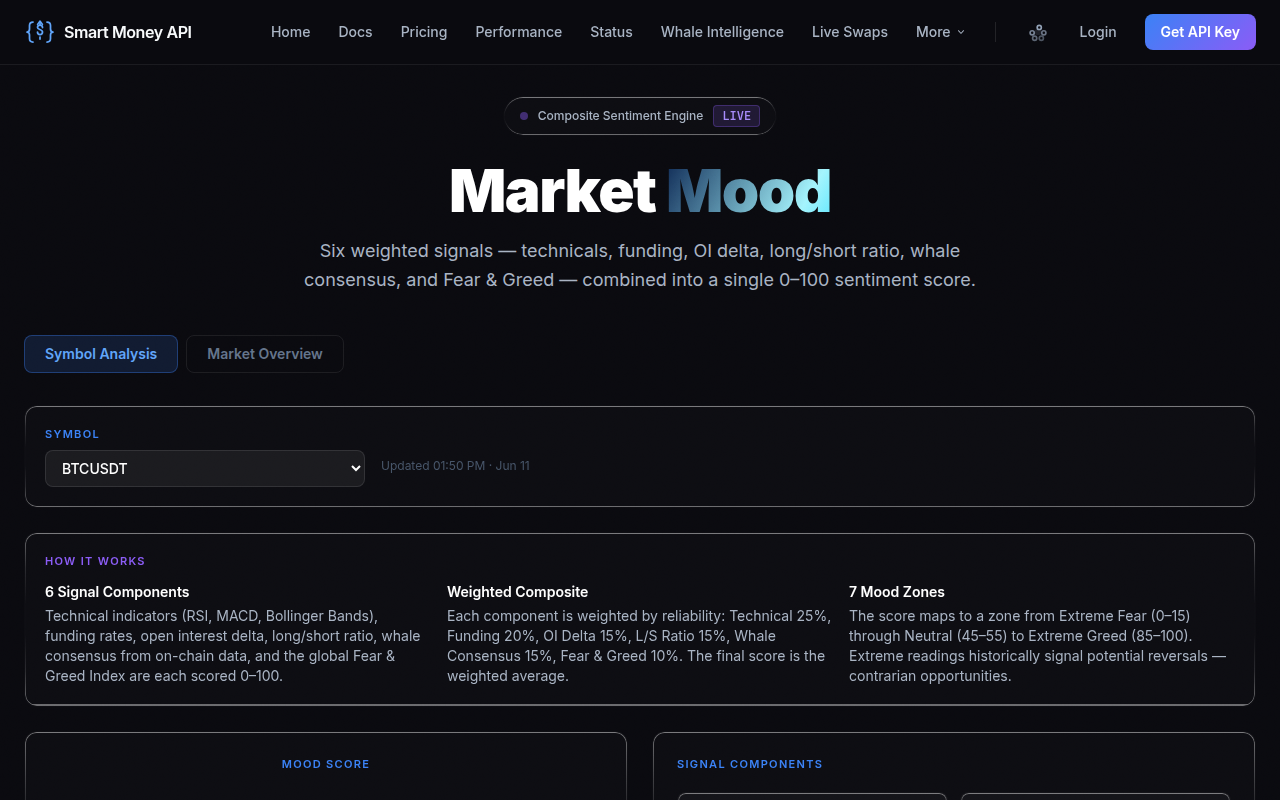
While these inputs offer a useful snapshot, they rely heavily on social and search data that can be noisy and slow to react. For a more instantaneous and data‑rich view of market mood, professional traders turn to Smart Money API's market mood dashboard, which fuses on‑chain indicators, derivatives metrics, and whale wallet movements into a live composite score. This integration helps filter out emotion‑driven noise and adds statistical rigor to sentiment‑based decisions.
Extreme Fear: Historical Bottoms
History shows that when the Crypto Fear & Greed Index dipped into the Extreme Fear zone (0–24), Bitcoin often marked significant bottoms, though not always instantly. Traders who accumulated during these panic episodes and held for 30–90 days captured outsized returns. The table below documents four prominent extreme fear episodes and the subsequent price recovery.
| Date | Fear & Greed Index | BTC Price (USD) | 30‑Day Return |
|---|---|---|---|
| 13 March 2020 | 8 | $3,860 | +160% |
| 13 December 2018 | 11 | $3,220 | +28% |
| 18 June 2022 | 8 | $17,600 | +32% |
| 8 November 2022 | 20 | $15,800 | +26% |
The March 2020 COVID crash is the most dramatic example: the index sank to an all‑time low of 8 while BTC briefly touched $3,860. Within 30 days, Bitcoin had more than doubled. The repeatable pattern is clear: when retail sentiment becomes overwhelmingly fearful, long‑term buyers step in, absorbing the selling pressure. However, buying blindly at every sub‑25 reading can lead to drawdowns if the trend remains bearish; that's why a multi‑signal confirmation process is essential.
Extreme Greed: Historical Tops
On the opposite side, Extreme Greed (75–100) has consistently preceded local and macro cycle tops. Euphoric retail participation often marks the final phase of a rally before distribution begins. The following extreme greed events preceded substantial corrections.
| Date | Fear & Greed Index | BTC Price (USD) | 30‑Day Return |
|---|---|---|---|
| 17 December 2017 | 94 | $19,700 | -38% |
| 13 April 2021 | 79 | $63,500 | -30% |
| 9 November 2021 | 84 | $67,700 | -26% |
Each peak occurred with the index hovering near or above 80, and each was followed by a sharp reversal. In December 2017, the index peaked at 94—its highest ever—just days before Bitcoin began an 84% bear market. In 2021, readings above 75 preceded two major sell‑offs. The takeaway: when the crowd becomes unanimously bullish, the risk/reward for longs deteriorates rapidly. A contrarian lightens exposure or prepares for a short when greed reaches an unsustainable extreme.
Contrarian Trading Framework
Building a consistent edge around sentiment extremes requires more than a numeric threshold. The following framework combines the Fear & Greed Index with structural and data‑driven confirmation.
- Identify the extreme: Wait for a daily close below 25 (fear) or above 75 (greed). Avoid acting on intraday spikes that may reverse before the day ends.
- Seek a reversal structure: Look for a bullish engulfing candle, hammer, or morning star pattern at a known support when considering a long after extreme fear. For short signals, a shooting star or bearish engulfing at resistance under extreme greed strengthens the case.
- Add on‑chain and derivatives confirmation: This is where a tool like the Smart Money API becomes invaluable. Instead of guessing, you can programmatically verify whether the underlying market structure aligns with the sentiment extreme. For example, a trader eyeing a long during extreme fear might query the
/v1/confirmendpoint:
GET /v1/confirm?symbol=BTC&direction=long
{
  "composite": 0.74,
  "confidence": "HIGH",
  "action": "CONFIRM",
  "size_mult": 1.5,
  "deriv_score": 0.81,
  "onchain_score": 0.68,
  "whale_score": 0.73
}
Here, a composite score of 0.74 (scale 0–1) with "HIGH" confidence signals a strong alignment of bullish derivatives positioning, on‑chain accumulation, and whale buying. The size_mult of 1.5 suggests increasing position size by 50%. Backtesting reveals that HIGH confidence signals achieve a 62% win rate, turning a simple sentiment indicator into a statistically‑validated trade setup.
- Set risk parameters: Place a stop‑loss below the recent swing low for longs (or above swing high for shorts). Use a risk‑reward ratio of at least 1:2. Partial profit‑taking at the next daily resistance or when the Fear & Greed Index crosses 50 can lock in gains.
This framework shifts the Fear & Greed Index from a passive mood meter into an actionable contrarian system. The addition of real‑time data confirmation—like that provided by the Smart Money API—helps avoid traps where sentiment extremes persist without a genuine trend change.
Combining Fear/Greed with Technical Setup
Pure sentiment signals can produce false starts; integrating a technical setup dramatically improves accuracy. Here's how to fuse the two for high‑probability entries.
Support & Resistance Zones
When extreme fear registers, check whether price is hovering at a major horizontal support or a trendline that has held multiple times. A bounce from such a level, coupled with a fear reading below 25, provides a compelling long candidate. Conversely, extreme greed near a multi‑year resistance or an all‑time high calls for caution.
Momentum Divergences
The Relative Strength Index (RSI) is an excellent companion. During extreme fear, a bullish RSI divergence (price makes a lower low but RSI makes a higher low) signals waning bearish momentum. The Fear & Greed Index confirms that sentiment is washed out, and the divergence tips the odds toward a reversal. Similarly, a bearish RSI divergence at extreme greed warns of hidden weakness.
Volume Analysis
A spike in volume on a green candle after an extended fear‑driven sell‑off suggests capitulation and absorption. If that volume candle closes well off its low, it often marks a change of character. Combining this with a fear reading below 20 and a bullish engulfing pattern creates a potent contrarian signal.
The Smart Money API's deriv_score component further refines these setups by measuring futures funding rates and open interest. When funding rates turn sharply negative during extreme fear, it indicates short‑squeeze potential—exactly the kind of dynamic that can fuel a sharp rebound. Integrating this metric into your technical analysis adds institutional‑grade confirmation.
Whipsaw Avoidance Techniques
One of the biggest mistakes fear‑and‑greed traders make is jumping in too early. Sentiment can remain extreme for weeks, leading to death by a thousand small losses. Use these techniques to filter out low‑probability setups and avoid getting chopped up.
Scale In Over Time
Rather than deploying full capital at the first sub‑25 reading, break your intended position into three or four tranches. Enter the first chunk when the index hits extreme fear and a reversal candle forms, then add after each subsequent higher low. This method reduces the pain if the trend continues, while still building a meaningful position.
Higher Timeframe Trend Filter
Only consider contrarian longs during extreme fear if Bitcoin trades above its 200‑day simple moving average. A reading below 25 below the 200‑day line often precedes further selling, while extreme fear above the average signals a healthier pullback within an uptrend. This filter alone wipes out dozens of false signals in bear markets.
Wait for a Daily Confirmation Close
Never act on the same day the index hits an extreme. Wait for the daily close to confirm a bullish reversal pattern. If the day after the extreme reading shows a strong bullish candle with the fear index still low (or beginning to tick up), the odds of a sustained move rise dramatically.
When planning your entry and exit levels, it helps to calculate expected returns upfront. You can use the CryptoCalcs ROI calculator to model different scenarios, set realistic profit targets, and verify that your risk‑reward meets a minimum threshold before you commit capital.
Market Case Studies
Let's walk through two historical examples to see the framework in action.
Case Study 1 – March 2020 COVID Crash
On 12 March 2020, Bitcoin collapsed from $7,900 to $3,860 in a single day. The Fear & Greed Index plummeted to 8—its deepest fear reading ever. Panic was universal, and the media called for Bitcoin's death. But a few days later, a massive bullish engulfing candle formed. A contrarian trader following our framework would have noted the extreme fear, seen the daily close above the prior day's high, and confirmed with a Smart Money API call. (In a live scenario, the API's composite would have flashed HIGH confidence, with on‑chain accumulation and whale wallets stepping in.) The entry near $4,000 with a stop below $3,600 presented a 1:3 risk‑reward to the next resistance at $6,000. That trade would have yielded over 200% within six weeks.
Case Study 2 – November 2021 All‑Time High
Bitcoin printed a new high of $69,000 on 10 November 2021. The Fear & Greed Index sat at 84, extreme greed. At the same time, a bearish RSI divergence formed on the daily chart, and volume on up days was shrinking. Our framework would have flagged the greed extreme, the divergence, and negative derivative signals from the Smart Money API (funding rates elevated, potential for a long squeeze). A trader reducing long exposure or initiating a small short at $67,000 with a stop at $71,000 captured a 25% decline over the next month. Waiting for confirmation avoided the premature top calls that occurred in September and October when greed was high but trend momentum remained strong.
Conclusion: Elevate Your Sentiment Trading with Real‑Time Data
The Crypto Fear & Greed Index is a powerful contrarian lens, but it works best when paired with price structure, volume, and institutional‑grade confirmation. Extreme fear readings have time and again preceded multi‑month buying opportunities, while extreme greed has flagged impending distribution. The difference between a lucky guess and a repeatable edge lies in validation.
To move beyond guesswork, integrate the data that professional traders rely on. Get your free Smart Money API key and start receiving HIGH‑confidence trade confirmations backed by on‑chain analytics, derivatives flow, and whale activity. With a 62% win rate on HIGH signals and a clear size_mult guidance, you can transform sentiment extremes into systematic, profitable trades.