What Are Perpetual Futures Funding Rates?
At the heart of crypto derivatives lies the perpetual futures contract — a product with no expiry date that tracks the spot price of an asset. To keep the perpetual price anchored to the spot index, exchanges use a mechanism called the funding rate. This is a periodic payment exchanged between long and short traders, typically every 8 hours. When the perpetual trades at a premium to spot, longs pay shorts, and the funding rate is positive. When the contract trades at a discount, shorts pay longs, and the rate flips negative. The funding rate isn’t set by a central entity; it’s calculated from the spread between the mark price and the index price, often smoothed over an interval.
The exact formula varies by exchange, but Binance, Bybit, and OKX all use a version of Premium = (Mark Price – Index Price) / Index Price, combined with an interest-rate component (usually 0.01% per day) to dampen extremes. The resulting funding rate becomes a real-time window into the balance of speculative pressure. A high positive funding rate signals that the market is overwhelmingly long, while a deeply negative rate points to aggressive short positioning.
Why Funding Rate Exists
Without a funding mechanism, a perpetual swap would trade at a persistent premium or discount to spot, making it unusable for hedging. The funding rate creates an economic incentive: if too many traders are long, they must pay a fee to shorts, which discourages excessive leverage on one side and encourages arbitrageurs to short the perpetual and buy spot, bringing prices back in line. This self-correcting cycle makes the funding rate a crucial gauge of sentiment and overextension.
How Traders Use Funding Rate Data
Traders monitor funding rates on multiple timeframes. The most common metric is the 8-hour rate quoted as a percentage. For example, a 0.1% rate every 8 hours translates to roughly 0.3% per day, or an annualized 109% — sustainable only in extreme bull runs. High funding can eat into long positions significantly, so many swing traders avoid adding leverage when rates are elevated. Conversely, persistent negative funding can offer a "carry" opportunity, but it often appears during bearish market regimes.
To calculate effective costs, traders frequently use tools like the CryptoCalcs Funding Rate Calculator, which projects payments based on position size and expected holding period. This hands-on approach turns raw funding percentages into actionable risk numbers.
Understanding Long/Short Ratio
The long/short ratio measures the proportion of traders — or more precisely, the proportion of open positions — betting on price increases versus decreases. Exchanges typically publish two versions: the accounts long/short ratio, which counts unique accounts that are net long or short, and the position long/short ratio, which weighs the actual contract quantities. A ratio of 2.0 means there are twice as many longs as shorts by count or by size, depending on the metric.
Sentiment analysis via this ratio is deceptively simple. A high ratio often suggests bullish consensus, but in derivatives markets, extreme readings can be a warning of crowded trades. Because every long must be matched by a short, the net imbalance is zero in terms of contracts outstanding. Thus, the ratio reflects the distribution of that open interest among participants, not net market exposure.
Accounts Ratio vs. Position Ratio
Retail-oriented exchanges often report the accounts long/short ratio, where a single trader with a 10 BTC long and another with a 1 BTC short would count as 1 long and 1 short — a neutral 1:1 ratio. The position ratio would show 10:1, revealing that the market is heavily skewed by large actors. Smart traders cross-reference both. A low accounts ratio (e.g., 0.8) with a high position ratio (e.g., 3.5) could mean that a small number of whales are heavily long while the crowd is net short — a potentially bullish setup if those whales have conviction.
Where to Find Long/Short Data
Major exchanges like Binance and OKX provide public long/short ratio dashboards, often with hourly snapshots. Third-party aggregators like Coinglass and Santiment compile multi-exchange metrics. For a deeper view, algorithmic traders can integrate derivatives data directly via APIs that normalize ratios across venues, enabling real-time alerts when ratios hit historical extremes.
Open Interest Basics
Open interest (OI) is the total number of outstanding derivative contracts (longs and shorts combined) that have not been settled. It’s a measure of market participation and capital commitment. Rising OI alongside a price rally suggests the trend is supported by fresh money; rising OI during a sideways range may indicate a buildup of leveraged positions ahead of a breakout. Falling OI signals contracting participation — either longs are closing or shorts are covering, and the trend may be losing steam.
OI-Weighted Funding Rate
Because a high funding rate with low OI is less dangerous than the same rate with astronomical OI, analysts often weight funding by open interest. An OI-weighted funding spike — when funding jumps as OI hits multi-month highs — frequently precedes deep corrections. Conversely, a negative funding rate with sky-high OI can signal overwhelming bearish sentiment that might reverse violently if a short squeeze occurs.
Combining OI with Long/Short Ratio
A classic setup: OI is rising rapidly, the long/short position ratio is climbing above 3, and funding is positive but not yet extreme. This shows increasing bullish leverage without full capitulation pricing. As funding rate eventually catches up and consumes long profits, the structure becomes fragile. When OI flattens and funding stays high, the market is at a tipping point — any price dip can trigger cascading liquidations.
Reading Funding Rates as a Contrarian Signal
Trading against extreme sentiment is one of the most profitable but difficult strategies in crypto. Funding rates offer a measurable, time-bound edge. When the 8-hour funding rate tops 0.1%–0.15% for an extended period, the cost to maintain longs becomes prohibitive. Eventually, momentum chasers run out of capital, and late longs get squeezed. Similarly, funding rates below −0.1% for days suggest an overcrowded short trade. Historical data shows that after three consecutive negative funding intervals during a bull market, BTC and ETH often rallied within the next 24–48 hours.
Historical Contrarian Examples
In November 2021, Bitcoin’s funding rate on Binance hit 0.35% per 8 hours, an annualized rate above 300%. Within a week, BTC dropped 12%. In January 2023, during the recovery rally, funding briefly turned negative while price was consolidating at $18,800 — a classic bear trap that preceded a surge above $23,000. These extremes don’t work as a standalone signal but become high-probability when combined with other derivatives data.
Timeframe Precision
Contrarian signals work best on the 8-hour or daily aggregate funding. Intra-hour spikes can be noise from single large liquidations. Savvy traders set alerts for funding rates exceeding the 90th percentile over a 30-day rolling window, triggering only when the reading persists for at least two funding cycles.
Combining Funding & Long/Short Data
Individually, funding rates and long/short ratios each tell part of the story. Fusing them creates a powerful leverage sentiment indicator. Consider four scenarios:
| Funding Rate | Long/Short Ratio (Position) | Interpretation |
|---|---|---|
| High positive | High (>2.5) | Overcrowded long; reversal risk elevated |
| High positive | Low (<1.2) | Explosive but fragile; few participants driving leverage |
| Negative | High | Bullish undercurrent; shorts may get squeezed |
| Negative | Low | Deep bearish sentiment; historically a bottom signal |
The most actionable combination occurs when funding tilts extremely negative but the position long/short ratio stays elevated (above 1.5). This contradiction means the crowd holds longs, yet they’re paying shorts, possibly because large short positions are entering via hedging or directional conviction. If price holds above a key support, it’s a powerful long entry trigger.
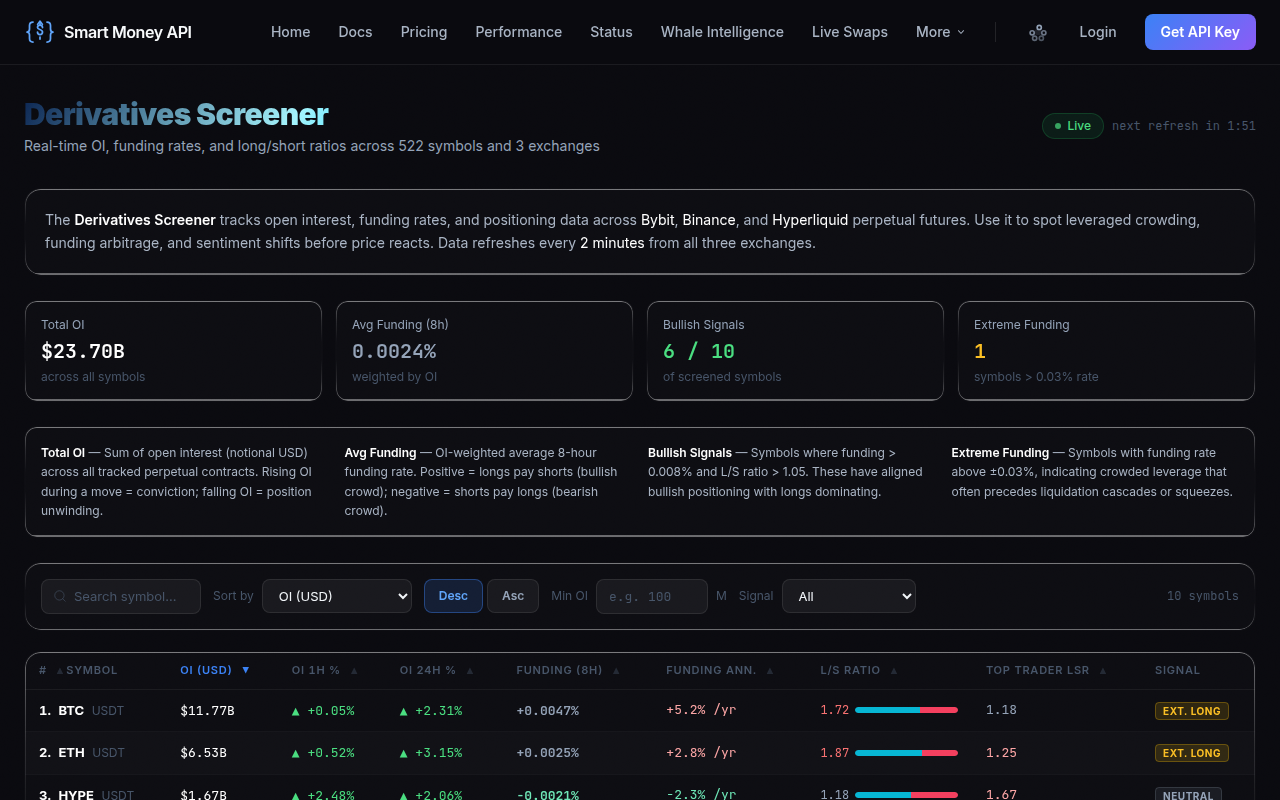
For traders who want to cut through the noise, Smart Money API’s derivatives screener takes this analysis further. It fuses funding rates, long/short ratios, on-chain flows, whale wallet activity, and macro news into a single composite trade-confirmation score. When the compositescore reaches HIGH, the model has historically delivered a 62% win rate, making it a valuable second opinion before entering a position.
Liquidation Clusters & Price Magnets
Derivatives markets don’t just reflect sentiment — they actively shape price. When leveraged positions get liquidated, the forced buying or selling creates momentum that can cascade. Liquidation clusters form at price levels where a large concentration of stop-loss and liquidation orders exist. These levels act as price magnets: the market often gravitates toward them to collect liquidity before resuming the primary trend.
Identifying Liquidation Heatmaps
Exchanges like Binance and Bybit display liquidation heatmaps showing cumulative long/short liquidation levels. Coinglass and Hyblock offer cross-exchange visualizations. When a price is approaching a massive cluster of long liquidations (below the current price), market makers have an incentive to push price down, trigger those liquidations, and buy the forced sell-off at a discount. The same dynamic works in reverse for short liquidations above the market.
Practical Entry and Exit Triggers
Trading with liquidation data involves waiting for the sweep. If the long/short ratio is stretched and funding is positive, and a heatmap shows a dense long-liquidation cluster 3% below the current price, fading the trend until that level is tested often yields a high-reward setup. After the sweep, if OI resets and funding cools, a reversal becomes attractive. This confluence of derivatives indicators — funding extremes, ratio extremes, and cluster sweeps — consistently marks local bottoms and tops.
Real-Time Derivatives Dashboards
Manually tracking funding rates, OI, and long/short ratios across multiple exchanges is time-consuming. Modern traders rely on dashboards that aggregate these metrics in real time, allowing custom alerts and visual comparisons. A robust derivatives dashboard should display at least the following: current funding rate on major exchanges, 8-hour and 1-hour trends, aggregated open interest with % change, long/short ratios by account and position, and liquidation heatmaps.
Smart Money API’s trade-confirmation endpoint goes beyond display. By calling a single REST endpoint, you can query a composite score that already blends all derivatives signals with on-chain and whale activity. For example:
GET /v1/confirm?symbol=BTC&direction=long { "composite": 0.74, "confidence": "HIGH", "action": "CONFIRM", "size_mult": 1.5, "deriv_score": 0.81, "onchain_score": 0.68, "whale_score": 0.73 }Here, a derivatives score of 0.81 indicates strong alignment across funding, ratios, and OI. The on-chain and whale scores add layers of confirmation, and the size_multiplier suggests scaling into the position with 1.5x the standard risk unit. This kind of automation transforms raw data into executable bias.
Risk Management with Leverage Data
Derivatives data is not just for entries — it’s essential for protecting capital. When aggregate leveraged positions balloon, the market becomes a tinderbox. Monitoring metrics like Estimated Leverage Ratio (open interest divided by exchange reserve balance) reveals how much borrowed money is at play. A spike in this ratio often precedes volatility; after the ratio peaks, price can move violently in either direction as over-leveraged traders get flushed out.
Avoiding Over-Leveraged Zones
A practical rule: when the estimated leverage ratio hits the 95th percentile of its 90-day range and funding is positive, reduce position size by half. Implement this automatically by connecting to a risk-management API or by manually checking dashboards before each session. Many traders use the CryptoCalcs Position Size Calculator to adjust risk dynamically — embedding funding and leverage metrics directly into their trade plan.
Leverage Sentiment as a Portfolio Hedge
For spot-heavy portfolios, monitoring derivatives data can act as a hedge signal. When funding rate is exceedingly positive and the long/short position ratio is above 3, consider selling partial spot into strength or buying protective puts if available. The cost of ignoring this signal in November 2021 was a 12% drop in a week; those who reduced exposure based on derivatives extremes protected significant gains.
Next Step: Build Your Derivatives Toolkit
Funding rates, long/short ratios, open interest, and liquidation clusters form the foundation of a professional trading edge. But raw data alone isn’t enough. The difference between a guess and a high-probability trade is the ability to combine these indicators into a coherent signal. Whether you’re a manual chartist or an automated bot builder, integrating a unified derivatives sentiment score saves time and removes emotional bias. Smart Money API offers a free tier that gives you access to real-time composite confirmation signals — covering derivatives, on-chain, and macro — without a credit card. Sign up for a free API key and start confirming your next trade with data that the pros use.