What Are Liquidation Cascades (And Why They Matter)
In leveraged crypto markets, a liquidation cascade is a chain reaction of forced position closures that feeds on itself, often turning a modest price move into an explosive breakout or crash. Understanding these cascades isn't just academic—it's the difference between getting run over and riding the wave of amplified volatility.
The Mechanics of a Cascade
When a trader opens a leveraged long, the exchange sets a liquidation price just below the entry. If the market trades at or below that price, the position is forcibly closed to prevent losses from exceeding the margin. That single closure becomes a market sell order. Now imagine thousands of leveraged longs clustered around the same liquidation level. As price drops and triggers the first few liquidations, those forced sales push price lower, which in turn triggers the next tier of liquidations. This domino effect ripples through the order book, creating a self‑reinforcing sell-off—or a short squeeze in the opposite direction.
Why Cascades Create Explosive Breakouts
Breakouts thrive on momentum. A classic breakout often stalls at a key resistance level, but when that resistance coincides with a dense cluster of short liquidations, the breakout becomes supercharged. As price pushes above resistance, it triggers a wave of forced short-covering (buy orders). The sudden buying pressure not only breaks the level with conviction but also accelerates the move well beyond typical measured targets. This is why liquidation cascade breakout events are so powerful—they combine technical breakouts with mechanical, non-discretionary order flow. Traders who anticipate these cascades can position themselves for high‑probability, high‑reward moves.
How Leverage Stacking Creates Cascade Risk
Leverage stacking is the silent architect of most cascade events. When the market trends, retail and institutional traders alike add to winning positions or pile into new ones with high leverage. Because many traders use similar price levels—such as recent highs, round numbers, or Fibonacci extensions—their liquidation prices converge. This liquidation clustering transforms a handful of individual stops into a dense band of potential forced order flow.
For example, if Bitcoin rallies to $65,000, speculative traders using 20x–50x leverage might open longs with an average entry of $64,800. Their liquidation prices often land within a narrow $500 band. A sudden $700 dip can cascade through those levels, generating a sell-off that drops price by $2,000 in seconds. Conversely, if the price breaks higher through a resistance cluster of shorts, the same levered positioning can fuel a violent short squeeze.
To assess your own exposure, you can use a precise liquidation calculator that accounts for entry price, leverage, and maintenance margin. Understanding your own liquidation distance is the first step toward recognizing when you might be adding to a crowded cluster.
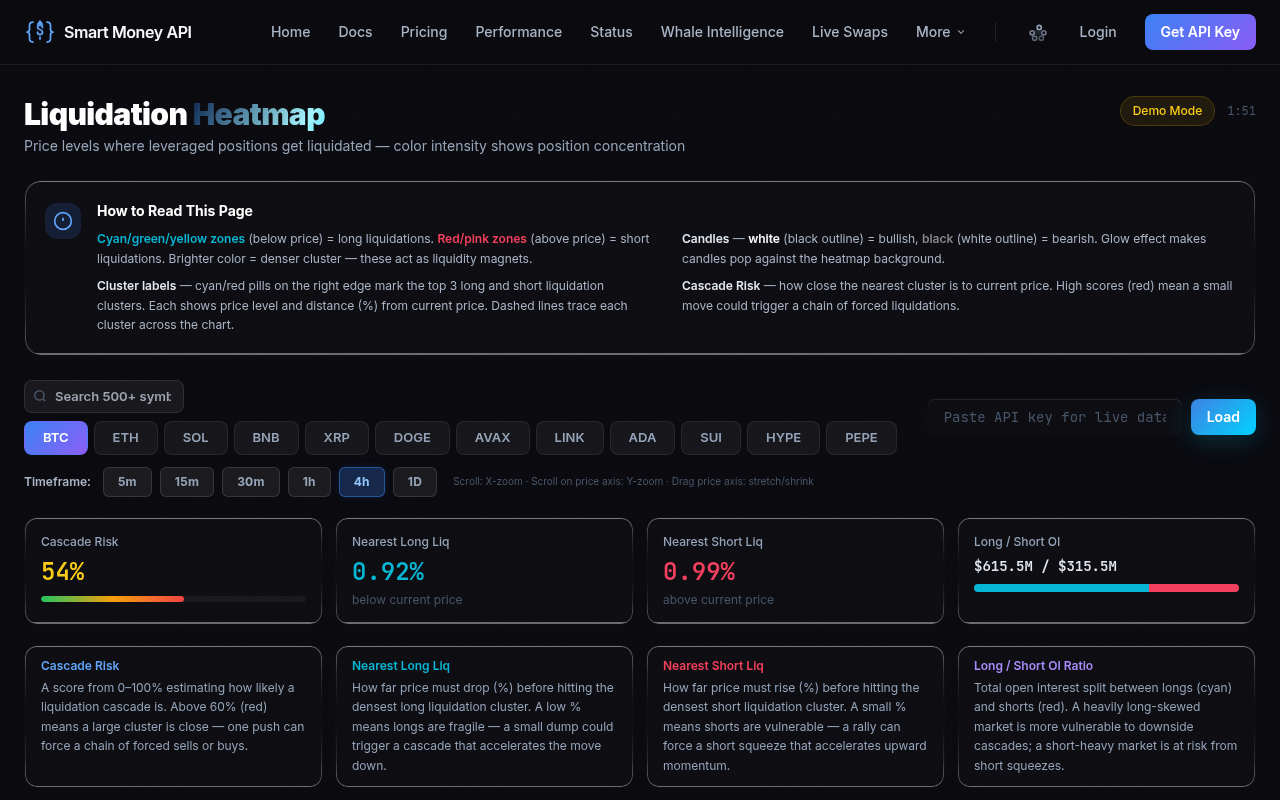
To quantitatively map these mounting risks, traders turn to liquidation heatmaps—visual representations of aggregate liquidation levels across major exchanges. These tools reveal exactly where the highest density of forced liquidations sits, allowing you to see the cascade minefield before it explodes.
Reading a Liquidation Heatmap: Density, Clustering, and Trigger Zones
A liquidation heatmap is not just a colorful chart—it's a real‑time map of cumulative liquidation leverage. Typically, the X‑axis represents time, the Y‑axis price, and the color intensity (or brightness) indicates the total notional value of liquidations expected at each level. Warm colors (red/orange) show massive leverage concentration, while cooler tones reflect lighter positioning.
Advanced platforms like Smart Money API’s heatmap aggregate data from Binance, Bybit, OKX, and other exchanges, offering a unified view of liquidation clustering. The key is to look for “hot zones”—price levels where multiple exchange heatmaps align with extreme density. These zones become trigger zones where even a small poke can unleash a cascade.
Density as a Predictor of Magnitude
Not all liquidation clusters are equal. A band with thin, scattered liquidation interests may cause only a modest bounce. But when a heatmap shows a thick, solid wall of red stretching for $1,000–$2,000, a cascade breakout is almost certain if price reaches that zone. The density tells you how much fuel is waiting to ignite. This is especially relevant for short liquidations above resistance: a dense cluster of forced buy orders can propel price far beyond the breakout point, offering a cascade breakout trade with a high risk‑reward ratio.
Clustering and the “Liquidation Squeeze”
Clusters rarely form in isolation. They often stack right above recent highs or below recent lows because that's where latecomers enter with stops just beyond. When price approaches, you'll often see a tug‑of‑war as market makers try to push into the cluster to harvest the liquidity. Monitoring the evolution of heatmap density over time can signal whether a cascade is imminent—a rapidly building cluster behind a key level is the hallmark of an impending avalanche.
Cascade Prediction: Support/Resistance vs. Liquidation Levels
Traditional support and resistance are based on past price interaction; liquidation levels are based on future forced order flow. The most explosive moves occur when these two concepts collide. Suppose Bitcoin has a strong resistance at $70,000, confirmed by multiple touches. A liquidation heatmap reveals a massive short‑liquidation wall from $70,200 to $71,500. A break above $70,000 not only breaches technical resistance but also enters the trigger zone for forced short covering. The result: a breakout that slices through resistance and extends rapidly into the liquidation cloud.
Here's a practical approach:
- Identify key S/R levels on higher timeframes (4H, daily).
- Overlay a liquidation heatmap to see if those levels coincide with dense liquidation clusters.
- Prioritize levels with “dual confirmation”—both technical significance and high‑density liquidations. These are prime candidates for cascade liquidation signals.
This hybrid analysis reduces false breakouts. A level that has only technical support but no real liquidation density is less likely to produce a cascading move; the breakout may lack the necessary fuel. Conversely, a liquidation cluster without a clear technical trigger may be a trap. Combining the two gives you a powerful filter.
Breakout Timing: Using Liquidation Density for Entry Conviction
Timing a breakout entry is notoriously difficult—too early and you risk a false start, too late and you chase. Liquidation density adds a quantitative edge. Rather than relying solely on candlestick patterns or volume spikes, you can gauge the strength of the impending move by the liquidation pool depth just beyond the breakout level.
Here's a simple framework:
- Confirm escalating density: Look for a rising heatmap wall behind the upcoming level. A 20%+ increase in notional liquidation value over the last few hours often precedes a cascade.
- Watch for price compression: As price coils near the trigger zone, the market is coiling the spring.
- Trigger entry on absorption: Once price enters the zone and the first thin layer of liquidations is absorbed, the cascade begins. Entering on the pause after the initial spike (retest of broken level as support) can offer excellent risk‑reward.
For an automated approach, Smart Money API’s /v1/confirm endpoint fuses derivatives, on‑chain, and whale data into a single trade‑confirmation score. It quantifies the likelihood of a sustained move, taking liquidation density into account. Here’s a real response for a BTC long signal:
GET /v1/confirm?symbol=BTC&direction=long
{
  "composite": 0.74,
  "confidence": "HIGH",
  "action": "CONFIRM",
  "size_mult": 1.5,
  "deriv_score": 0.81,
  "onchain_score": 0.68,
  "whale_score": 0.73
}
When the composite score is HIGH and the deriv_score (which includes liquidation clustering) is above 0.8, the probability of a cascade breakout is significantly elevated. This data‑driven confirmation can remove emotional guesswork from your timing.
Risk‑Reward: Position Sizing Into Cascade Zones
Trading into a liquidation cascade is high‑reward but carries unique risks—slippage, wicks, and the possibility of being on the wrong side of the avalanche. Proper position sizing is non‑negotiable. Because cascade moves can be extremely fast, your stop‑loss must be placed outside the cluster to avoid getting caught in the liquidation flutter.
A practical rule: calculate the maximum adverse excursion (MAE) based on the cluster width. If the short‑liquidation cluster spans $1,000 above a resistance breakout, your stop‑loss should sit at least $200–$300 above the far end of the cluster. Then use a leverage calculator to determine the optimal position size such that your stop‑loss distance corresponds to a comfortable risk percentage (e.g., 1–2% of capital).
Below is a table illustrating how different leverage levels affect liquidation proximity and cascade risk for a long position on Bitcoin with an entry at $60,000. Notice how higher leverage compresses the liquidation price closer to entry, making you more vulnerable to being stopped out inside a cluster.
| Leverage | Entry Price | Liquidation Price (Long) | Distance to Liquidation (%) | Cascade Exposure |
|---|---|---|---|---|
| 5x | $60,000 | $51,000 | ‑15.0% | Low – plenty of buffer |
| 10x | $60,000 | $54,545 | ‑9.1% | Moderate |
| 20x | $60,000 | $57,142 | ‑4.8% | High – easily caught in cascade wicks |
| 50x | $60,000 | $58,823 | ‑1.9% | Extreme – almost certain to liquidate in a minor cascade |
The sweet spot for cascade trading is often 5x–10x leverage, giving you enough breathing room while still amplifying returns. Pair this with a position size that aligns with your stop‑loss distance, and you can weather the violent swings typical of crypto breakout liquidations.
Case Study: Bitcoin Leverage Liquidations
On March 12, 2024, Bitcoin was trading around $71,000, consolidating below its all‑time high. The liquidation heatmap revealed a towering wall of short liquidations above $73,200, with cumulative notional value exceeding $2.8 billion on major exchanges. Meanwhile, bullish on‑chain metrics and whale accumulation scores from Smart Money API signaled a growing probability of a breakout.
When Bitcoin finally broke above $72,000, it was initially a standard breakout. But as price approached $73,200, forced short‑covering kicked in. Within two hours, Bitcoin surged to $76,500—a 5.6% move in a single day—as the cascade triggered layer after layer of liquidations. Traders who had identified this liquidation cascade breakout setup on the heatmap and confirmed it with Smart Money API’s composite score capitalized on the entire move with minimal drawdown.
This case study underscores the importance of mapping liquidation clusters ahead of time. The heatmap acted as a crystal ball, showing exactly where the avalanche would begin. By combining this with derivative‑onchain‑whale confluence, Smart Money API helped confirm the trade, allowing users to size up confidently.
Trade Cascades With Data‑Driven Precision
Liquidation cascades aren't random—they're the predictable outcome of leverage clustering and market structure. By mastering heatmap analysis, anticipating trigger zones, and timing your entries with quantitative confirmation, you transform a chaotic market event into a structured trade opportunity. To take your execution further, integrate real‑time liquidation heatmaps and the composite trade‑confirmation score into your workflow. Get a free API key at Smart Money API and start mapping cascade breakouts with institutional‑grade data today.