What Is the Long/Short Ratio?
Defining the Ratio
The long/short ratio is a derivative market sentiment meter that compares the number of open long positions (traders betting on price increases) against open short positions (traders betting on declines). It is usually calculated as either the ratio of total long contracts to short contracts, or the percentage of accounts holding long vs. short positions. When the ratio sits above 1.0 (or 50%), the crowd is net-long; below that, sentiment is net-short. This simple metric turns raw positioning data into a visual snapshot of market bias — a single number that often masks an emotional herd.
Where the Data Comes From
Exchanges like Binance, Bybit, OKX, and Deribit publish aggregate long/short ratios at regular intervals (often hourly or daily). While some platforms report the ratio of accounts, others report the ratio of contracts or notional value. The most reliable signals come from perpetual futures markets because they concentrate the highest leveraged speculative activity. Look for provider-level data that distinguishes between top traders and retail; institutional or whale positions frequently tell a more accurate story about smart money intent.
Why Aggregated Sentiment Matters
Crypto markets are reflexive: extreme positioning not only reflects existing bias but also creates the conditions for a violent snap the other way. When the majority of leveraged players are sitting on one side of the boat, a small price move can trigger a chain reaction of forced closures. That’s why the long/short ratio is not just a directional indicator but a timing tool for spotting when the market becomes dangerously stretched.
Market Sentiment Baseline vs Extreme
Establishing a Historical Baseline
Every asset has a typical range for its long/short ratio. Bitcoin, for instance, might hover between 0.9 and 1.5 in neutral conditions, with a median around 1.2. Altcoins with lower liquidity often show wider swings. The key is to track the ratio over time and identify what “normal” looks like on the timeframe you trade. A 30-day moving average of the ratio can smooth out intraday noise and reveal when the current reading deviates significantly from equilibrium.
Spotting the One-Sided Crowd
An extreme appears when the ratio pushes into the upper or lower decile of its historical distribution. For Bitcoin, a ratio climbing above 2.0–2.5 often signals an overleveraged long crowd; a ratio sinking below 0.5–0.7 points to an overleveraged short bias. The exact threshold varies by exchange and market cycle, but the principle holds: the more lopsided the positioning, the greater the potential energy for a reversal. Context matters — a ratio spike during a euphoric rally is more dangerous than one during a gradual accumulation phase.
The Noise vs. Signal Problem
Not every extreme reading predicts an immediate reversal. Sometimes the long/short ratio rises as momentum traders pile in, and price keeps moving with the trend for days or weeks. That’s why raw ratio values shouldn’t be traded in isolation. The most robust contrarian signals emerge when extreme sentiment collides with other exhaustion markers: overbought/oversold RSI on higher timeframes, negative funding rates, or observable whale distribution. Filtering noise with a composite approach is precisely what sophisticated tools like Smart Money API aim to solve by merging derivatives, on-chain, and whale wallet data into a single actionable score.
Overleveraged Long Setup
Anatomy of a Bull Trap
The overleveraged long scenario is the classic contrarian setup. Picture Bitcoin grinding up day after day, mainstream media running headlines about new all-time highs, and the long/short ratio climbing past 2.5. At that point, nearly three out of four positions are long. Many of those longs entered late, using high leverage to chase the move. Market makers and large players have ample incentive to press price down into the liquidity cluster—triggering stop losses and forcing levered traders to sell into a falling market. The result is a sharp, swift correction that liquidates overextended bulls, often faster than anyone expects.
Identifying Overextension
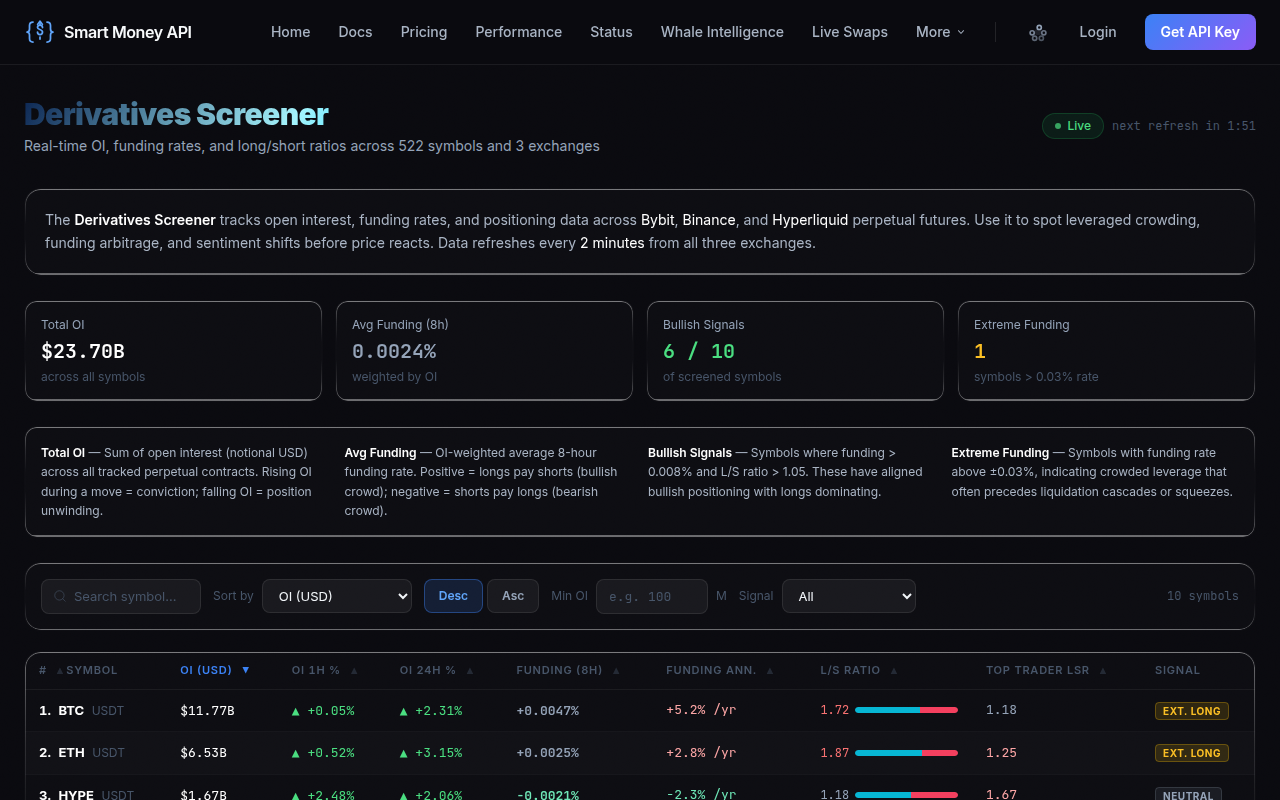
In addition to a stretched ratio, watch for these red flags: open interest soaring alongside price (sign of new hot money entering), funding rates flipping highly positive (indicating longs are paying shorts a premium), and spot CVD (cumulative volume delta) turning negative while futures longs remain record-high. When you spot these conditions together, the market is a pressure cooker. A simple scan of the derivatives landscape using a comprehensive tool like Smart Money API's derivatives screener can surface assets where the long/short ratio, funding, and open interest are all flashing warnings simultaneously — saving you the trouble of manual analysis across multiple exchanges.
Overleveraged Short Setup
When Bears Become Too Greedy
The mirror image is the overcrowded short. After a prolonged downtrend, the long/short ratio can fall to extreme lows (below 0.5 on many exchanges). Fear is pervasive, and traders compete to add shorts, often at high leverage, betting on further collapse. In this environment, any positive news or a large buyer stepping in can ignite a short squeeze. Because the market is so one-sided, buys required to cover short positions rapidly push price higher, forcing even more shorts to cover in a cascading loop. Historically, these squeezes produce the most violent rallies in crypto, with 20–40% moves in a day not uncommon.
Short Squeeze Dynamics
The mechanics are identical but reversed: liquidated short positions become forced buy orders, adding fuel to the upward move. The long/short ratio often lags the initial price spike because the ratio is measured snapshot-style, but open interest will drop sharply as positions are wiped out. Monitoring real-time liquidations alongside the ratio helps confirm that a squeeze is underway, not just a regular bounce. When you see an extreme low long/short ratio combined with a sudden spike in short liquidations, the contrarian long entry is validated.
Liquidation Cascade Mechanics
How Forced Selling/Buying Amplifies Moves
Liquidation cascades are the engine behind extreme reversals. When price hits a cluster of liquidation levels, exchanges automatically close positions, regardless of trader intent. A cascade begins when a modest price move triggers a first wave of liquidations. Those forced orders push price further into the next batch of liquidation levels, triggering more forced orders, and so on. The long/short ratio is the fuse; a heavily skewed ratio ensures there is tremendous ammunition on one side, ready to be detonated by a small initial spark.
The Domino Effect on Price
During a long liquidation cascade, sell orders flood the order book, often consuming buy-side liquidity in milliseconds. Wicks of 10% or more become common, only to retrace partially as the cascade exhausts itself. This is why timing contrarian entries is delicate: you want to enter after the cascade has relieved the extreme positioning, not before it starts. Using a liquidation calculator can help you understand at what price your own position would be forcibly closed, which is essential for managing risk in such volatile environments.
Combining with Funding Rates
Funding as a Secondary Confirmation
Funding rates are the other half of the sentiment puzzle. The funding rate is a periodic payment between longs and shorts in perpetual futures that keeps the contract price anchored to the spot price. When funding is highly positive, longs pay shorts; when deeply negative, shorts pay longs. An extreme long/short ratio alongside a very high funding rate (say, >0.1% per 8 hours) tells you that not only is positioning one-sided, but it’s also expensive to maintain that side—creating a strong incentive to unwind. This combination precedes many major tops and bottoms.
The Double Extreme Signal
Look for the double extreme: long/short ratio in its 90th+ percentile and funding rate in its 95th+ percentile simultaneously. In bull markets, this setup warns of an impending long flush; in bear markets, the mirror condition (ratio extreme low, funding deeply negative) signals an imminent short squeeze. Blending these data points manually is time-consuming, which is why many traders lean on platforms that aggregate derivative metrics. For a consolidated view, Smart Money API's derivatives screener combines funding, long/short ratio, and whale activity. Here’s an example of what a bullish confirmation on Bitcoin looks like when the system detects a contrarian reversal signal after extreme bearish sentiment:
GET /v1/confirm?symbol=BTC&direction=long
{
  "composite": 0.74,
  "confidence": "HIGH",
  "action": "CONFIRM",
  "size_mult": 1.5,
  "deriv_score": 0.81,
  "onchain_score": 0.68,
  "whale_score": 0.73
}
Historical Examples
Bitcoin's May 2021 Meltdown
In the weeks before Bitcoin crashed from $58,000 to $30,000 in May 2021, the long/short ratio on major exchanges had climbed above 2.8—an all-time high at the time. Funding rates flipped positive and hit 0.15%–0.25% per 8-hour period. The positioning was so lopsided that when the sell-off began, over $10 billion in long positions were liquidated within days, accelerating the drop into a full-blown cascade. The contrarian signal was screaming, yet few listened until it was too late.
Ethereum's Merge Pivot
Leading up to the Ethereum Merge in September 2022, many traders expected a “sell the news” event, pushing the long/short ratio on ETH to just 0.6. Short sellers piled in aggressively, driving funding negative. When the Merge executed smoothly, the subsequent short squeeze pushed ETH from $1,500 to $2,000 in less than a month. The depressed ratio and negative funding together were a textbook contrarian buy signal.
| Asset | Date | Long/Short Ratio Extreme | Funding Rate (8h) | Resulting Move |
|---|---|---|---|---|
| BTC | May 2021 | 2.8 (overleveraged long) | +0.20% | −48% in 14 days |
| ETH | Sep 2022 | 0.6 (overleveraged short) | −0.05% | +33% in 3 weeks |
| SOL | Dec 2023 | 3.2 (long extreme) | +0.12% | −28% in 10 days |
| DOGE | Nov 2023 | 0.4 (short extreme) | −0.08% | +47% in 5 days |
Meme Coin Mania 2023
Low-cap coins like PEPE saw astronomical long/short ratio spikes during retail manias. In early 2023, PEPE’s ratio surged past 5.0 on some exchanges, with funding rates exceeding 0.5% per 8 hours. The inevitable unwind erased 60% of its value inside a week. The pattern repeats: whenever a token’s ratio leaves the realm of statistical normalcy, gravity tends to return with a vengeance.
Trading the Capitulation Bounce
Entry Timing and Risk Management
The most profitable contrarian trades come not from fading the extreme immediately, but from waiting for the liquidation event to finish and then entering in the direction of the snap. After a cascade, the long/short ratio resets toward normal, funding rates moderate, and open interest drops—creating a clean slate. Entering on a bounce off a high-timeframe support or breakout of a downtrend, with confirmation that extreme positioning has been purged, offers a high-probability setup. Always pair this with strict risk management: use a position size calculator to ensure you’re risking no more than 1–2% of capital per trade, and set hard stops below the recent cascade low.
Using Smart Money API for Confirmation
Instead of guessing whether the flush was sufficient, traders can lean on a composite score that synthesizes derivatives sentiment, on-chain flow, and whale wallet activity. Smart Money API’s confirmation endpoint returns a “confidence” level and an action (CONFIRM or WAIT), allowing you to filter subjective bias. In the earlier API example, a HIGH confidence long signal with a composite score of 0.74 and a size multiplier of 1.5 suggests the market is poised for a trend continuation and that a larger position size is justified relative to baseline. Integrating such signals into a disciplined plan turns the long/short ratio from a curiosity into a money-making contrarian edge.
Turn Sentiment Extremes into Measurable Trades
The long/short ratio is one of the purest reflections of crowd psychology in crypto, but raw data alone won’t keep you ahead of the liquidation cascades that repeatedly destroy leveraged traders. By layering the ratio with funding rates, open interest deltas, and whale footprints, you can identify the moments when market consensus has become a ticking time bomb. Those who systematically track these extremes and act with a contrarian, data-backed process gain an asymmetric advantage. To bake this intelligence directly into your workflow, grab a free API key from SmartMoneyAPI.com and start verifying reversals before the herd feels the snap.