Mining Economics: Revenue, Profitability, and Selling Pressure
Bitcoin mining is one of the most capital-intensive industries in crypto. Miners must constantly balance hardware costs, electricity expenses, and hashpower efficiency against the block subsidy they earn. Each block currently pays 3.125 BTC (post the April 2024 halving), plus transaction fees, which remain a small portion of total revenue except during fee spikes. The halving mechanism cuts this subsidy in half every 210,000 blocks, creating sudden revenue shocks that ripple through the network.
Mining profitability, often measured in dollars per terahash per day ($/TH/day), is a function of Bitcoin’s price and network difficulty. When price falls or difficulty rises, many miners—especially those with older ASICs or higher energy costs—begin to operate at a loss. At that point, they face a choice: turn off their machines or sell a larger portion of their mined BTC to cover operational expenses. This forced selling can create downward price pressure, a phenomenon known as “miner capitulation.”
The mining revenue cycle thus becomes a leading indicator for Bitcoin’s supply-side dynamics. When miner selling intensifies, the market often absorbs this extra supply at lower prices until the weakest hands are shaken out. Post-halving, the immediate drop in revenue per block accentuates this process, compressing margins and forcing the least efficient miners offline. The resulting drop in total hash rate eventually triggers a difficulty adjustment downward, making mining easier for survivors and setting the stage for a new equilibrium.
Understanding this revenue and selling pressure cycle is the first step to spotting accumulation windows. Traders who track miner flows and the hash ribbon can identify when the worst of the selling has passed and miners begin to hoard supply, a historically bullish pivot point.
Miner Inflow Tracking: When Miners Send BTC to Exchanges
On-chain data providers such as Glassnode and CryptoQuant offer a metric called “Miner to Exchange Flow” which tallies the number of coins sent from miner-controlled wallets to exchange deposit addresses. A sudden spike in this metric often precedes a wave of selling. For instance, during the 2020 halving period, daily miner-to-exchange inflows surged from around 1,000 BTC to over 3,000 BTC as smaller miners liquidated inventory to cover costs.
Conversely, when these flows dry up or even reverse (net outflows from exchanges to miner wallets), it suggests miners are accumulating. Accumulation phases tend to occur after the market has absorbed the selling pressure and hash rate has bottomed. A steady decline in miner-to-exchange flow, combined with a recovering hash rate, signals that miners are holding onto their newly minted Bitcoin in anticipation of higher prices.
Keeping tabs on raw on-chain metrics can be time-consuming and noisy, however. That’s where aggregated intelligence plays a role. Platforms like Smart Money API compile miner flows, whale wallet activity, and derivatives positioning into a single composite confirmation score, helping traders cut through the clutter.
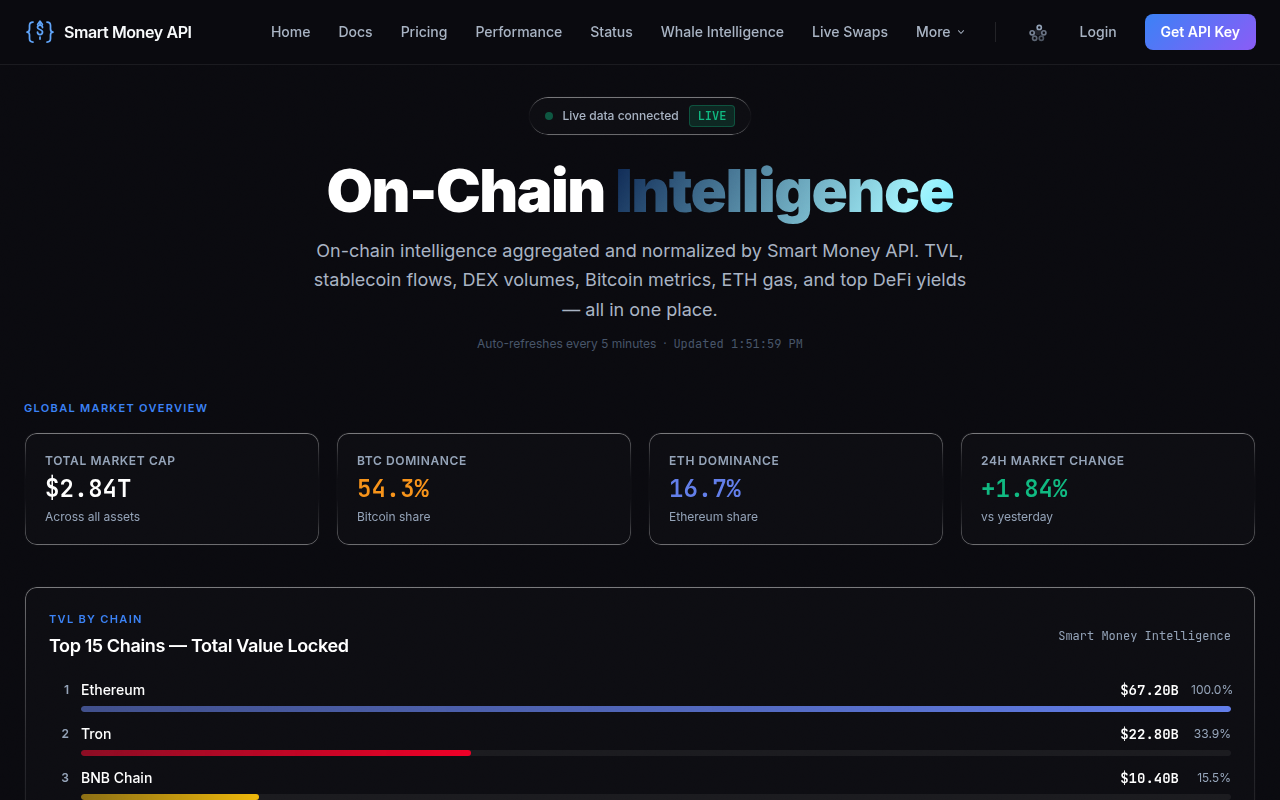
The dashboard visualizes miner inflow and outflow trends alongside other on-chain indicators, making it easier to spot divergences. For traders who prefer a systematic approach, the API also offers programmatic access so you can incorporate these signals directly into your automated trading bots.
Hash Ribbon Reversal: The Difficulty-Price Signal
The hash ribbon, invented by Capriole Investments founder Charles Edwards, is one of the most respected macro indicators for Bitcoin. It uses two moving averages of the network hash rate: a 30-day and a 60-day. When the 30-day MA crosses below the 60-day MA, it indicates that miner capitulation is underway—hash rate is declining because unprofitable miners are shutting off. When the 30-day MA crosses back above the 60-day, it signals that the worst is over and the remaining miners are expanding again, usually after a difficulty adjustment has restored profitability.
Historically, the hash ribbon reversal has marked some of the best risk/reward buying opportunities in Bitcoin’s history. In late 2018, after the bear market bottom, the ribbon flashed a buy signal as hash rate began to recover from the crash. In May 2020, following the halving, the hash ribbon entered capitulation for a few weeks before a powerful reversal in June—just before Bitcoin broke above $10k and embarked on a 600% rally over the next year. More recently, in late 2022 following the FTX collapse, the ribbon again bottomed and crossed up, preceding a strong recovery in early 2023.
The indicator works because it indirectly captures the interplay between Bitcoin’s price and mining difficulty. As price declines, some miners capitulate, reducing hash rate. Higher difficulty takes time to adjust (every 2016 blocks, roughly two weeks), so during periods of rapid price drops, the hash rate dips and the ribbon shows stress. Once difficulty recalibrates downward, miners who survived enjoy higher margins and often accumulate, causing the ribbon to reverse.
While the hash ribbon is a broad macro signal, it can be refined by overlaying miner flow data. For example, if you see the hash ribbon nearing a crossover while miner-to-exchange flows plummet, the conviction of a bottom increases.
Post-Halving Dynamics and Forecast
The April 2024 halving reduced the block subsidy to 3.125 BTC, immediately cutting new daily issuance from ~900 BTC to ~450 BTC. In the months that followed, the network hash rate initially dropped from an all-time high of over 650 EH/s to around 580 EH/s, reflecting the exit of some inefficient miners. This pullback was expected and mirrored patterns from previous halvings.
Looking ahead, the post-halving mining ecosystem is settling into a new normal. Large-scale public miners have been upgrading to next-generation ASICs like the Antminer S21, which operate at under 20 J/TH, ensuring they remain profitable even at lower revenue per TH. Meanwhile, the era of Ordinals and Runes has occasionally boosted transaction fees, providing a supplementary income stream for miners. These dynamics suggest that the severity of miner capitulation may be less than in past cycles, but the buildup of selling pressure could still emerge if the Bitcoin price stagnates below production costs for marginal miners.
From a trader’s perspective, the post-halving period is a historically bullish window over a 12-18 month timeframe. The supply squeeze coupled with steady ETF-driven demand, especially from institutions, sets the stage for upward price movement once the initial miner shakeout concludes. Tracking the hash ribbon and miner flows during this window can help you time entry into spot positions or leverage trades. For instance, once the 30-day hash rate MA moves decisively above the 60-day with declining miner outflows, it could be a signal to scale in.
As you plan your trades, practical tools like the futures calculator help you manage position sizes and risk, while the ROI calculator lets you project potential returns if you buy during such accumulation phases. These free resources let you simulate outcomes and avoid overleveraging. If Bitcoin price holds above $60,000, most miners remain profitable, delaying capitulation. However, a drop to sub-$50,000 could trigger a significant shakeout. Traders should watch for the hash ribbon to flash if that occurs.
Combining Miner Flows with On-Chain Whale Data
While miner behavior offers a powerful signal, no indicator should be used in isolation. On-chain whale activity—large holders with over 1,000 BTC—often corroborates or contradicts miner flows. If miners begin accumulating while whales are also adding to their positions, the confluence dramatically elevates the probability of a sustained upswing. Conversely, if miners start selling but whales are buying, it could indicate that deep-pocket investors view the dip as a buying opportunity, softening the bearish impact.
Smart Money API’s composite confirmation engine excels at merging these signals. It fuses derivatives, on-chain, and 1,500+ whale wallets into one score. For a long Bitcoin trade, you might see:
GET /v1/confirm?symbol=BTC&direction=long
{
  "composite": 0.74,
  "confidence": "HIGH",
  "action": "CONFIRM",
  "size_mult": 1.5,
  "deriv_score": 0.81,
  "onchain_score": 0.68,
  "whale_score": 0.73
}
Here, the onchain_score of 0.68 reflects healthy miner flow data (e.g., low exchange inflows), while the whale_score of 0.73 indicates that large wallets are accumulating. The overall composite of 0.74 with HIGH confidence suggests a robust risk-on environment. According to backtests, such HIGH signals have achieved a 62% win rate, and the size_mult factor helps traders dial up exposure responsibly.
Integrating this multi-dimensional view into your trading stack means you’re not just guessing at miner intentions but verifying them through real-time whale and derivatives activity. It replaces the need to constantly monitor dozens of charts with one reliable metric.
Mining Pools vs. Solo Miners: Accumulation Patterns
The mining landscape is not monolithic. Large mining pools like Foundry USA, Antpool, and F2Pool account for the majority of Bitcoin’s hash rate. These pools typically distribute mining rewards to participating miners on a daily or weekly basis, with each miner deciding whether to sell or hold. Therefore, pool-level outflow data aggregates thousands of individual decisions, often masking the behavior of larger, more sophisticated miners who may be accumulating.
Some publicly traded mining companies, such as Marathon Digital and Riot Platforms, have adopted HODL strategies—keeping a portion of mined BTC on their balance sheets. Their outflows are thus smaller relative to their mined output, which can be picked up by on-chain analysts through entity-adjusted metrics. Solo miners, on the other hand, often sell more quickly to cover operating costs, especially small-scale at-home miners with thin margins.
Tracking accumulation patterns by entity type provides nuance. For instance, if pool outflows remain high but known corporate miner wallets are stable, it suggests that retail-oriented pool participants are selling while big players hold. Smart Money API’s whale tracking identifies and labels many of these corporate miner addresses, so their accumulation becomes part of the whale_score. This layer of detail helps traders avoid false bearish signals that might be driven by small miner liquidations while large miners are quietly stacking sats.
Case Study: Halving Mining Capitulation
Let’s examine the 2020 halving and subsequent miner capitulation to see these principles in action.
On May 11, 2020, Bitcoin’s block reward halved from 12.5 BTC to 6.25 BTC. In the weeks prior, miner-to-exchange inflows had been relatively low, around 500-800 BTC per day, as miners hoarded anticipating a price increase. Immediately after the halving, revenue per TH/s plunged, and a wave of sell pressure hit the market. By late May, daily miner-to-exchange flows spiked to over 3,000 BTC—the highest in years. The hash rate fell from a peak of ~120 EH/s to ~90 EH/s as older generation S9 miners were switched off permanently.
The hash ribbon confirmed the stress: the 30-day hash rate MA crossed below the 60-day MA in late May, entering capitulation territory. This lasted for about three weeks. Then, as difficulty adjusted downward by around 9% on June 4, mining became more profitable for survivors, and hash rate began to recover. The ribbon reversed on June 15, flashing a buy signal.
Bitcoin’s price at the time of the hash ribbon buy was approximately $9,500. Within two months, it had climbed to $12,000; by the end of the year, it was above $29,000; and within 12 months, it topped $60,000. Traders who combined the hash ribbon signal with declining miner-to-exchange flows (which fell back to pre-halving levels by July) had a highly confident entry point.
| Phase | Miner Exchange Inflow (30d avg) | Hash Rate (EH/s) | BTC Price (USD) | Signal |
|---|---|---|---|---|
| Pre-Halving (April) | ~800 BTC | ~120 | $7,000–$8,500 | Accumulation |
| Capitulation (May) | ~2,500 BTC | ~90 | $8,500–$9,200 | Sell pressure |
| Recovery (June) | ~600 BTC | ~110 | $9,500–$10,500 | Buy (Hash Ribbon) |
| Bull Phase (July onward) | ~400 BTC | ~130+ | $10,500–$60,000 | Strong Hold |
This case study illustrates the power of combining miner flows and the hash ribbon. The capitulation was short-lived, but it provided a clear window of maximum opportunity. Similar patterns have played out in every halving cycle.
Turn Miner Intelligence into Actionable Trades
Miner flows and the hash ribbon offer a unique, supply-side lens into Bitcoin’s market cycles. By understanding the economics of mining revenue, tracking when miners send coins to exchanges, and waiting for the hash ribbon reversal, you can spot accumulation windows with a historically strong edge. Adding whale data and derivatives confirmation, as provided by the Smart Money API, further refines these signals into high-probability trade setups.
Whether you’re a spot investor looking to deploy capital during post-halving dips or a futures trader seeking confirmation for a leveraged long, integrating these tools can meaningfully improve your timing. The Smart Money API’s free tier gives you instant access to composite confirmation scores, whale wallet tracking, and on-chain analytics—the very metrics discussed in this article. Sign up for your free API key and start building a data-driven trading system. And don’t forget to use the complimentary crypto calculators at thecryptocalculators.com to size your positions and project your potential gains.