What is Open Interest (OI) and Why It Matters
Open interest (OI) is the total number of outstanding derivative contracts—futures or options—that have not been settled. Unlike trading volume, which resets each session, OI accumulates until positions are closed, exercised, or liquidated. In crypto markets dominated by perpetual swaps, OI acts as a real‑time barometer of market participation and conviction.
When OI rises, it means new capital is entering the market, whether traders are adding longs or shorts. A sustained OI uptrend alongside price suggests a strong directional commitment. Conversely, falling OI signals that traders are reducing exposure—either voluntarily taking profits or being forced out through liquidations. Monitoring OI helps you gauge whether a move is supported by fresh money or just a short‑covering bounce. This is the foundation of every open interest divergence crypto strategy: comparing what price is doing with what OI is doing to detect hidden weakness or strength.
Open Interest vs. Volume
Many traders confuse OI with volume. While both measure activity, volume measures the number of contracts traded in a period, whereas OI captures open positions. For example, a high‑volume day with unchanged OI indicates a lot of day trading but no net new positioning. A day where volume is low but OI spikes suggests stealth accumulation or distribution—large players building positions without fanfare. Understanding this difference is critical for interpreting open interest divergence crypto signals correctly and for filtering noise out of your OI analysis trading.
Why OI Is a Leading Indicator of Market Participation
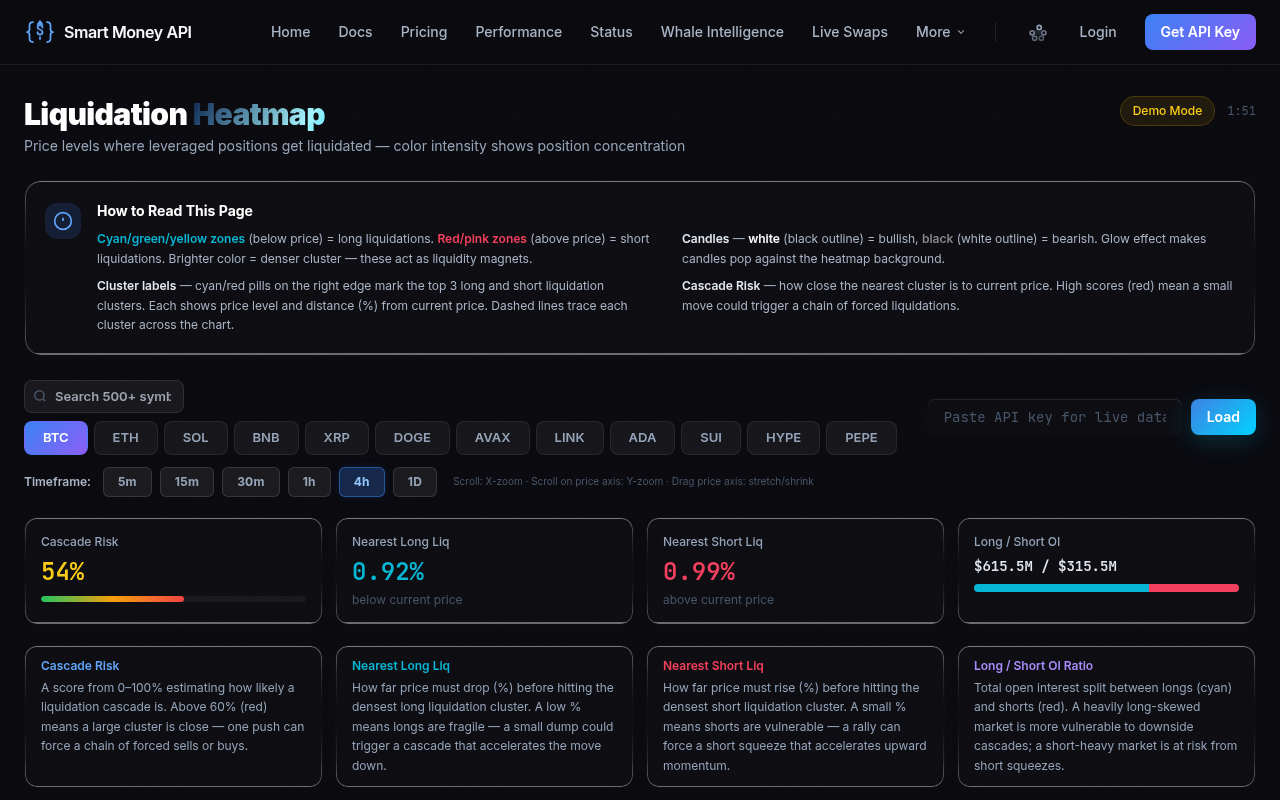
OI is forward‑looking because it reflects traders’ willingness to hold levered exposure overnight. In bull markets, rising OI confirms that buyers are absorbing selling pressure. During the 2020–2021 Bitcoin rally, OI on major exchanges climbed from under $2 billion to over $20 billion, mirroring the influx of institutional and retail capital. When OI starts to plateau or decline while price still rises, it’s often the first whisper of exhaustion—a powerful open interest signal that a top may be near. Platforms like the Smart Money API heatmap let you visualize OI changes across exchanges in real time, making it easier to spot these divergence patterns long before price reacts.
OI vs. Price: Bullish and Bearish Divergences
The classic way to read OI is by aligning it with price action. Four basic combinations emerge:
- Price up + OI up – Bullish, new money supports the trend.
- Price up + OI down – Bearish, short‑covering rally or distribution; no new longs.
- Price down + OI up – Bearish, aggressive new shorting, likely continuation.
- Price down + OI down – Bullish, long liquidation climax or trend exhaustion.
Divergence adds nuance. A bullish OI divergence occurs when price prints a lower low while OI makes a higher low or rises—this suggests accumulation by smart money buying into weakness. Conversely, a bearish OI divergence appears when price reaches a higher high but OI fails to confirm with a new high or begins to fall, signaling that the uptrend is losing sponsorship. In crypto, these OI analysis trading patterns frequently precede multi‑thousand‑dollar moves.
Bullish OI Divergence in Practice
Imagine Bitcoin dropping from $30,000 to $25,000 with a spike in OI. Retail may be panic‑selling, but the OI rise indicates large traders are opening fresh longs. If price later reverses, the OI buildup acts as fuel for a squeeze higher. Such a futures positioning signal often marks the end of a correction. Combining this with a positive open interest signal from derivatives data elevates the trade’s probability.
Bearish OI Divergence – The Warning Before the Crash
A textbook example occurred in November 2021 when Bitcoin reached an all‑time high near $69,000. OI had already peaked weeks earlier and was trending lower. Price kept inching up on dwindling participation, a classic OI peak reversal setup. Those who recognized the leverage exhaustion had a caution flag; within weeks, BTC had plunged 40%.
Leverage Exhaustion: High OI + Flat Price = Risk of Flush
When open interest hits an extreme level and price moves sideways or only grinds slowly, the market builds a debt‑laden equilibrium. This is leverage exhaustion: longs (or shorts) are crowded, and the marginal buyer is exhausted. A minor adverse price move can trigger cascading liquidations, leading to a violent flush. In crypto, these liquidations often exceed hundreds of millions of dollars in minutes.
This scenario is the core of an OI peak reversal play. The open interest signal spikes to a local high, price stalls, and funding rates point to the overcrowded side. The setup doesn’t require a catalyst; the weight of leverage itself becomes the catalyst.
Signs of Overheated Long‑Side OI
- OI on perpetuals rising aggressively while price struggles to break a key resistance.
- Funding rates positive and climbing (longs paying shorts a premium).
- Liquidation levels for longs clustered just below the current price.
For instance, in mid‑2023, Bitcoin oscillated between $30,000 and $31,000 while OI pushed to a yearly high. The leverage exhaustion was palpable—eventually a cascade wiped out $200 million in longs within an hour. Before entering any high‑risk setup, always use a reliable leverage calculator to determine the appropriate position size and avoid overexposure.
Signs of Overheated Short‑Side OI
When OI balloons during a downtrend but price refuses to break support, it’s a warning of a possible short squeeze. Funding rates turn deeply negative, and liquidations stack on the upside. Recognizing this futures positioning signal can save you from trying to catch a falling knife and instead profit from the violent reversal.
OI Contraction: Liquidation Squeeze or Conviction Exit?
Not all OI declines are equal. A sharp drop in OI after a large liquidation event signals a forced deleveraging—a liquidation squeeze. A gradual OI contraction with price stability, on the other hand, suggests voluntary position reduction, often from smart money taking profits after a trend. Distinguishing between the two is critical for asking whether the move is over or just taking a breather.
Forced Exits vs. Voluntary Position Reduction
If OI collapses alongside a large price spike and massive liquidations on the losing side, it’s a classic squeeze. For example, a bearish OI divergence that resolves with a sharp rally and OI dropping by 20% in an hour is a short squeeze—a temporary event, not a trend reversal. In contrast, if OI slowly bleeds lower over several days while price meanders, it’s a sign of leverage exhaustion leading to a genuine trend transition. This distinction makes OI analysis trading more precise.
Using Liquidation Heatmaps
Liquidation heatmaps from platforms like Coinglass show where large clusters of leverage sit. When OI contraction coincides with the clearing of a massive liquidity pool, it’s likely a squeeze. If OI drops without touching those clusters, it’s conviction exit. Integrating these heatmaps with your open interest divergence crypto monitoring provides a complete picture.
Exchange‑Specific OI: Binance vs. Bybit vs. Deribit
Not all OI is born equal. The exchange where the open interest resides gives context about trader types and potential signal reliability. Retail‑driven OI spikes on Binance can be noisy, while institutional flows on Bybit often produce cleaner divergences. Deribit’s options OI offers an entirely different lens through which to view leverage exhaustion and gamma‑driven reversals.
| Exchange | Typical BTC OI (Billions) | OI Divergence Signal | Remarks |
|---|---|---|---|
| Binance | $4 – $8B | Rapid OI spikes on news; flattening OI with price making lower highs = bearish | Largest retail participation; OI often tops before price. |
| Bybit | $2 – $5B | Slower OI buildup; OI decline during a rally = institutional distribution | More sticky; cleaner divergence on 4H/ daily charts. |
| Deribit | $10B+ (notional options) | Call OI spike with stagnating price = gamma top | Options OI provides leading volatility signals. |
When trading across these venues, precise sizing is everything. Use a futures calculator to convert your risk into the correct number of contracts, accounting for each exchange’s tick size and margin rules. This keeps your OI analysis trading actionable and safe.
Combining OI with Funding Rate and Liquidation Data
OI alone can be misleading, but when layered with funding rates and liquidation levels, it becomes an incisive tool. Funding rates reveal the cost of leverage and which side is paying a premium. Liquidation data shows the dominoes waiting to fall. Together, they transform an open interest signal into a high‑confidence trade.
Funding Rate and OI Confluence
When OI is rising and funding rates are persistently positive, the market is heavy with overleveraged longs. If price then stalls, a long squeeze is imminent. Conversely, rising OI with deeply negative funding indicates an overcrowded short that could explode upward. For example, during the summer of 2023, Bitcoin’s funding turned negative while OI kept climbing—a futures positioning signal that preceded a ferocious short squeeze.
Liquidation Levels and OI Clusters
Large liquidation clusters often sit just above resistance or below support. When OI builds around these levels, a breakout or breakdown becomes a self‑fulfilling prophecy—a move triggers liquidations, which fuels the move further. Monitoring OI divergence alongside these clusters helps you anticipate the direction and intensity of the cascade.
Manually monitoring all these metrics across multiple dashboards is overwhelming. The Smart Money API synthesizes OI, funding rates, on‑chain flows, and whale wallet activity into a single trade‑confirmation score. For instance, querying a long confirmation on Bitcoin returns actionable intelligence:
GET /v1/confirm?symbol=BTC&direction=long
{
  "composite": 0.74,
  "confidence": "HIGH",
  "action": "CONFIRM",
  "size_mult": 1.5,
  "deriv_score": 0.81,
  "onchain_score": 0.68,
  "whale_score": 0.73
}
Such scores distill the noise into a clear open interest signal, letting you trade leverage exhaustion setups with institutional‑grade data.
Trading Setup: OI Divergence + Liquidation Cascade
Here is a complete, repeatable trading framework that turns open interest divergence crypto theory into a systematic edge:
Entry Rules
- Identify divergence: Price makes a higher high while OI makes a lower high (bearish) OR price makes a lower low while OI makes a higher low (bullish). Use at least the 4‑hour timeframe for reliability.
- Confirm with funding: For bearish plays, funding should be positive (or turning positive). For bullish, negative funding adds conviction.
- Locate liquidation clusters: Find the nearest large liquidation wall that, if broken, would trigger a cascade. The cascade direction should align with your trade (longs for a bullish breakout, shorts for a bearish breakdown).
- Wait for the flush: Enter only after the liquidation cascade starts. Let the market clear overleveraged positions, then look for OI to stabilize.
Stop‑Loss Placement and Risk Management
Place stops just beyond the liquidation cluster’s extreme wick, or use a volatility‑based stop (e.g., 2x ATR). Because liquidation cascades are violent, leverage should be conservative—1x to 3x max. Always calculate your position size with a leverage calculator to align risk with your stop distance. For multi‑exchange plays, verify your margin with a futures calculator before pulling the trigger.
Example: BTC OI Divergence Trade
In October 2023, Bitcoin climbed from $27,000 to $30,000 while OI on Binance was declining—bearish divergence. Funding was mildly positive. A liquidation cluster of longs sat at $30,200. As price tapped that level, longs got liquidated, dragging BTC to $28,500. After the flush, OI stabilized and a bullish divergence formed (lower price, higher OI). Entering long there yielded a +12% rally in four days. This clean OI peak reversal illustrates why coupling OI analysis trading with liquidation mechanics is so powerful.
Conclusion: Make OI Divergence the Backbone of Your Trading
Open interest divergence is not a magic bullet, but it is one of the most honest indicators in the crypto market. It reveals when leverage is peaking under the surface, when smart money is quietly accumulating, and when a cascade is about to ignite. From a simple open interest signal on a 4‑hour chart to a full‑blown funded confluence, OI belongs in every serious trader’s toolkit.
Take your OI analysis to the next level with tools built for the job. The Smart Money API offers a free tier that delivers real‑time derivative scores, whale alerts, and composite trade confirmations. Sign up today for a free API key at Smart Money API and start executing conviction‑backed trades with a 62% win rate on HIGH signals. Don’t just watch leverage peaks hide weakness—trade them with precision.