What Is a Liquidation Heatmap?
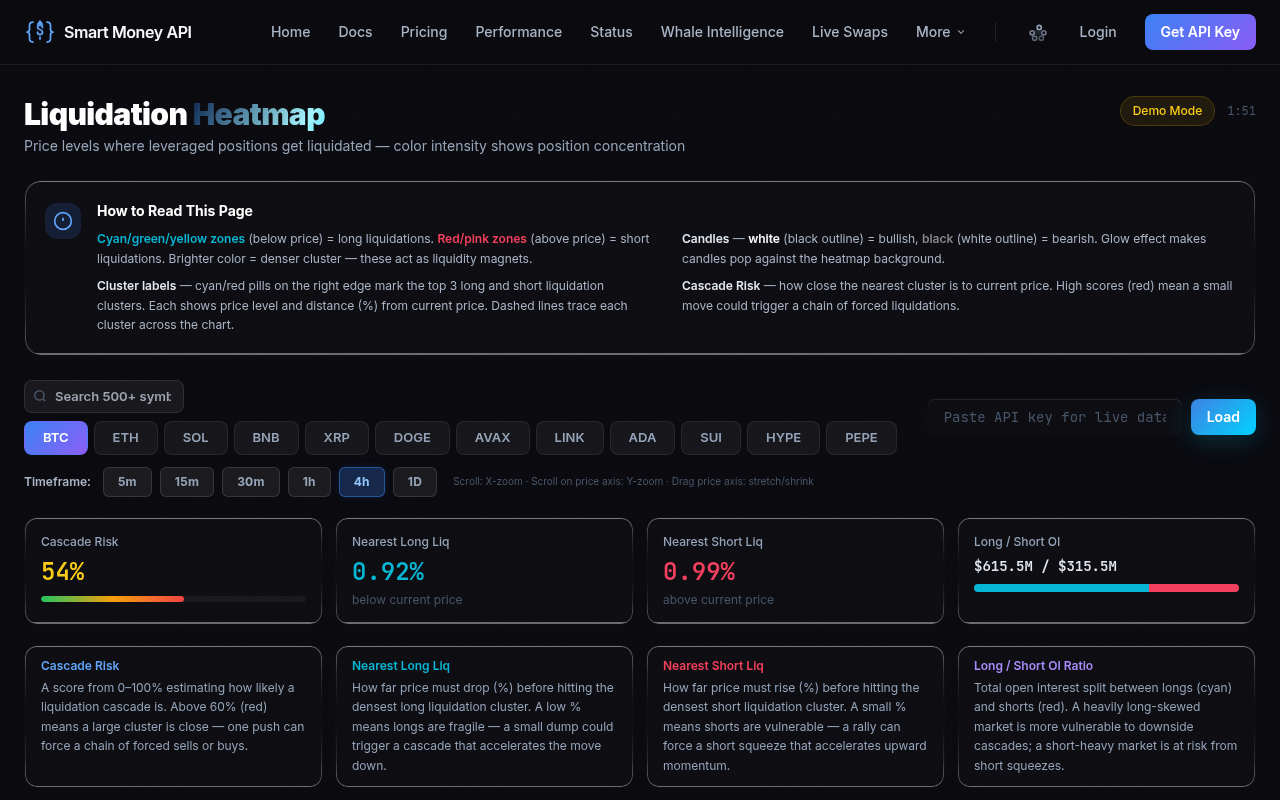
A liquidation heatmap is a dynamic visual tool that displays the estimated concentration of forced-liquidations across a price chart. Unlike traditional candlestick or volume indicators, it overlays color fields directly on the price axis – reds and oranges where leveraged positions are most likely to be wiped out, blues and greens where liquidation risk is relatively thin. The chart ingests open interest data from derivatives exchanges, maps each outstanding contract to its liquidation price based on the trader’s margin and leverage, and then clusters those price points into a heatmap. The result is a real-time map of where the pain lives.
Understanding Forced Liquidation
In crypto derivatives, every leveraged position carries a forced liquidation price – the exact mark where the exchange will automatically close the trade to prevent further loss. For longs, this sits below entry; for shorts, above. When price hits these levels, the exchange sells (or buys) the collateral, creating a cascade effect that can push price further into a cluster of liquidations. The heatmap aggregates all these individual levels into a single distribution, revealing zones where a sudden price move could trigger an avalanche.
How Exchanges Calculate Liquidation Prices
Exchanges use different formulas depending on margin mode (isolated vs. cross) and contract type. A typical isolated long liquidation price is roughly Entry * (1 – 1/leverage). For example, a 25x long entered at $60,000 liquidates around $57,600. A heatmap collects such levels from thousands of positions and projects them forward. The larger the open interest and the higher the leverage, the denser the liquidation cluster becomes – that’s where the heatmap shines brightest.
Why It Matters for Traders
By visualizing crypto liquidation levels in advance, traders can anticipate high-volatility zones, plan entries/exits around them, and avoid being the exit liquidity for whales. It’s a rare lens into the “other side” of the order book, delivering insights that open interest alone can’t provide.
Reading Color Gradients & Intensity
Every liquidation heatmap uses a color spectrum to encode the size and density of liquidation clusters. Typically, cool colors (blue, green) represent low liquidation concentration – price can likely move through these regions with minor friction. Warm colors (yellow, orange, red) signal dense clusters, sometimes into the millions of dollars. The brighter and more intense the spot, the larger the pool of forced-liquidations waiting to be triggered.
Decoding the Color Spectrum
Imagine a heatmap from a major exchange: pale blue = negligible liquidations, green = small pockets, yellow = notable, orange = heavy, and deep red = extreme. A trader scanning the chart might see a thick red band just below a critical support level – indicating a massive pile of long-liquidations. If price dips into that band, a cascade becomes almost inevitable. The gradient is not just eye candy; it’s a quantitative heat-signal.
What Bright Spots Mean
A bright, compact hotspot typically reveals that a large swath of traders entered at roughly the same price with similar leverage. This often happens around psychological round numbers, news-driven spikes, or after prolonged trends where leverage builds up lazily. Recognizing these bright spots helps you avoid entering just above a sea of liquidations or, conversely, to position for a sweep-and-reversal when all those stops get run.
Interpreting Heatmap Intensity Over Time
Intensity isn’t static. As open interest changes – positions opened, closed, or liquidated – the heatmap updates. A fading hotspot suggests that the cluster is either getting liquidated or traders are closing. A growing, intensifying zone warns of an approaching volatility bomb. The Smart Money API’s liquidation heatmap open interest data refreshes continuously, merging derivatives flow with on-chain and whale metrics to paint a full picture.
Open Interest Concentration Zones
Open interest (OI) is the total number of outstanding derivative contracts. A high OI combined with strong directional bias creates a ripe environment for violent liquidations. An open interest heatmap overlays this data onto price levels, mapping exactly where the leverage is sitting. The heaviest OI zones become self-fulfilling prophecy zones – because when price enters them, liquidations fire, amplifying the move.
The Relationship Between OI and Liquidation
Think of OI as dry brush, and the liquidation price as the match. A spike in OI at a certain level is like a pile of tinder. A deep red heatmap cluster with rising OI is the market’s way of saying: “Break here, and things get wild.” If OI drops while price moves into a hotspot, it means liquidations are already taking place, often accompanied by increased volume. Monitoring OI alongside heatmap intensity reveals whether we’re building up for a future move or already igniting one.
Identifying Leverage Clusters with an Open Interest Heatmap
Modern open interest heatmap tools – including those powered by derivatives APIs – let you filter by instrument (BTC, ETH, etc.) and observe week-long accumulations. For example, if a $30K BTC level shows a tall red bar on the heatmap while OI there grows 20%, it’s a sign that leveraged longs are piling in, each with a liquidation price uncomfortably close. That’s a high-probability liquidity zone. Trading around it means either front-running the squeeze or waiting for the washout.
Price Magnet Effect
One of the most discussed phenomena among derivatives traders is the price magnet effect: the tendency for price to drift toward large liquidation clusters. It’s not superstition – it’s market mechanics. Large liquidity pools act as attractors because moving price into them can trigger stop-hunts, flush leverage, and create the kind of volatility that profit-seeking algorithms and market makers capitalize on.
Why Liquidity Attracts Price
When a dense liquidation cluster sits just below the market, short-term sellers can push price down to grab that liquidity, knowing that forced selling from longs will accelerate the drop. This liquidity grab often provides the fuel for a reversal, as deep-pocketed buyers sweep the panic. Similarly, a stack of short-liquidations above price can draw a spike upward to squeeze late shorts. The heatmap essentially marks the bullseye for these stop-hunt moves.
Market Maker Behavior
Market makers and high-frequency traders actively scan liquidation heatmaps to find profitable imbalances. If they see a thin book above a heavy liquidation zone, they may buy aggressively, trigger the forced buy-ins, and sell into the spike. The heatmap lays bare this battle plan. Recognizing the layout allows retail traders to ride the wave instead of being crushed by it.
Case Study: BTC Liquidation Cascade
Consider a recent BTC sweep: price hovered at $63K, with a large red cluster of long-liquidations at $61.5K. Open interest was elevated, and the heatmap showed a solid orange-to-red band. Within hours, a flash dip hit that cluster, triggering $200M in long-liquidations, only for price to rebound sharply back to $64K. The heatmap told the story in advance – the magnet pulled price down, and once the liquidations were cleared, the path higher was clean.
Reading Live Liquidation Data
Access to live liquidation data transforms heatmap theory into actionable trades. Instead of guessing, you can observe where real forced closures are happening right now, and – more importantly – where they will happen if price moves a few percent. This real-time layer is what separates professional traders from chart-only retail.
Tapping into a dedicated API brings this data into your platform. The Smart Money API fuses derivatives liquidation levels with on-chain flows, whale wallet tracking, and macro signals. A typical confirmation call might return:
GET /v1/confirm?symbol=BTC&direction=long
{
  "composite": 0.74,
  "confidence": "HIGH",
  "action": "CONFIRM",
  "size_mult": 1.5,
  "deriv_score": 0.81,
  "onchain_score": 0.68,
  "whale_score": 0.73
}
Here, a high deriv_score points to heavy liquidation clustering; the composite score validates the trade direction. Tools like this give you a “heatmap in a box” – you no longer need to manually parse exchange data. The API’s heatmap visuals are built directly from these aggregated scores, making it easy to spot the zones where liquidations become almost inevitable.
Integrating with Your Trading Setup
Many traders use the API to fire alerts when price enters a pre-defined heatmap hotspot. Others overlay the data onto TradingView through custom indicators. The key is having a reliable, low-latency feed of forced liquidation price estimates and open interest changes. That’s where a dedicated service wins over a generic exchange screenshot.
Setting Alerts at High-Liquidity Levels
Once you’ve identified dense liquidation clusters on the heatmap, the next step is to act before the move. Setting price alerts at the boundaries of these liquidity zones gives you a head start. For example, if a large long-liquidation band sits at $40,000, an alert 1-2% above that zone lets you prepare for a potential sweep and reversal.
Configuring Alerts for Forced Liquidation Prices
Using a tool like CryptoCalcs’ liquidation calculator, you can compute the exact liquidation price for any leverage and entry. Combine that with a heatmap: if your own position’s forced-liquidation level aligns with a heavy cluster, you’re at risk of being caught in a cascade. Set a hard stop-loss well above that zone for longs, or below for shorts. Then set an alert at the cluster boundary. When it triggers, you have two options: bail early or add to the position if you expect a liquidity grab. The heatmap turns the alert into a high-probability event signal.
Tools That Simplify Alerts
Most heatmap platforms and APIs let you define custom horizontal levels and receive push notifications. The Smart Money API, for instance, can output liquidation cluster concentrations as JSON, which you can feed into a trading bot to automate position management. Paired with a position size calculator, you can dynamically adjust your risk based on cluster size.
| Leverage | Liquidation Distance (%) | Heatmap Intensity |
|---|---|---|
| 5x | ~20% | Low to Moderate |
| 10x | ~10% | Moderate |
| 25x | ~4% | High |
| 50x | ~2% | Very High |
The table illustrates why high-leverage clusters burn so bright: a tiny price move wipes out heavily-leveraged positions, making the zone extremely dense. Setting alerts at these distances from current price keeps you vigilant.
Breakout vs Reversal at Liquidation Zones
Not all liquidation clusters resolve the same way. A dense band can act as a support/resistance floor that holds, or it can be demolished by a breakout, triggering the cascades. The outcome depends on context: trend strength, volume profile, funding rates, and macro sentiment.
Bullish Scenarios: Breakout Above Liquidity
If price approaches a thick short-liquidation zone from below with rising volume and a supportive bullish structure, the cluster can fuel a breakout. As price chews through the stops, forced short-covering accelerates the move. In this case, the heatmap hotspot becomes a launchpad. Entering on the breakout – with a stop just below the cluster – often yields high R:R trades. The Smart Money API’s confirmation scores, when showing HIGH confidence and a positive deriv_score, help filter such setups.
Bearish Scenarios: Rejection at Liquidity
When a long-liquidation cluster sits below, and price approaches from above with waning momentum, the zone often acts as a magnet that sucks price down, triggering the cascade, but then fails to follow through. The result is a liquidation trap and a sharp reversal. Recognizing this requires monitoring heatmap intensity alongside actual liquidations in real time. If liquidations spike but open interest doesn’t drop, the cluster wasn’t fully cleared – expect a second leg. If OI collapses and price rebounds, the zone has been “cleaned” and a reversal is more likely.
Using Heatmap Alongside Other Signals
Never trade liquidation zones in isolation. Pair the heatmap with funding rates (extreme positive funding often accompanies crowded longs – boosting the chance of a sweep), CVD (Cumulative Volume Delta) divergences, and on-chain data like exchange netflows. The Smart Money API bundles many of these signals into a single composite, which simplifies decision-making when a hot zone is hit. For those who build their own stack, integrating a heatmap with these additional layers creates a formidable strategy.
Avoiding Liquidation Traps
The ultimate goal of studying liquidity zones trading is not just to profit from them but to avoid becoming the liquidity. Liquidation traps occur when price triggers a cluster, you expect a cascade, but the market violently reverses, catching you offside. They’re most common around large psychological levels and during low-volume sessions.
Common Liquidation Traps
- The Wedge Fakeout: Price pokes into a hotspot, triggers a few liquidations, then snaps back. The trap kills early entrants and then runs the opposite direction.
- Weekend Whipsaws: Thin liquidity on weekends means a modest move can trigger a cluster, but without institutional flow, the move lacks follow-through.
- News-Driven Spikes: A sudden headline causes a violent spike that clears a cluster, only for the price to completely retrace minutes later.
Protecting Your Position with Risk Management
To avoid these traps, always know your own forced liquidation price. Use the position size calculator from CryptoCalcs to ensure your leverage is appropriate. A common rule: never allow your liquidation price to fall within a known heatmap cluster unless you are actively trading a sweep-and-reversal setup with a tight stop. Even then, position sizing is critical – risk no more than 1-2% of your account on any heatmap-based play.
Using Heatmaps to Place Stop-Losses
Place stop-losses just beyond the edge of a heatmap cluster, not inside it. For a long entry above a long-liquidation zone, your stop goes below the cluster base. For a short, it goes above the short-liquidation cluster. If the cluster gets run, you want to be out before the cascade. Let the heatmap define your invalidation point – it’s one of the most logical frameworks for stop placement because it’s based on actual market structure, not arbitrary percentages.
Additionally, the Smart Money API’s continuous monitoring can surface when a cluster is being “hunted” in real time, helping you adjust stops dynamically or exit before the washout. Combining these signals with careful calculation tools keeps you on the right side of the liquidity game.
Put Liquidation Heatmaps to Work for Your Trading
Mastering the liquidation heatmap open interest is one of the fastest ways to evolve from a reactive trader to a proactive one. By visualizing where the explosive moves are likely to happen, you align your entries and exits with the market’s liquidity engine. Color gradients reveal danger and opportunity; open interest zones tell you where the crowd is most exposed; and the price magnet effect shows you why price often hunts these clusters. Now, the final piece is having the right data at your fingertips.
Get free access to a real-time liquidation heatmap and a complete crypto derivatives intelligence suite by signing up at Smart Money API. The free tier includes high-confidence trade confirmations, whale wallet tracking, and the same heatmap data that powers professional desks. Turn liquidation clusters into your edge – not your enemy.