Stablecoin Flows: Why They Matter More Than You Think
When Bitcoin surged past $50,000 in early 2024, many analysts pointed to ETF inflows. But the real story was written months earlier — in the quiet accumulation of stablecoins on exchanges. Stablecoin flows on-chain are the plumbing of the crypto economy, and reading them correctly gives traders a rare edge: visibility into macro liquidity before price moves.
Stablecoins like USDT, USDC, and DAI represent the largest pool of risk-free capital in crypto. Unlike fiat, they settle instantly on-chain, and their movements are public. When massive amounts of stablecoins flood into exchange wallets, it's not a coincidence — it's buying power being prepositioned. Conversely, a sudden exodus often signals risk-off behavior, profit-taking, or even a market top. Recognizing these anomalies is the foundation of stablecoin inflow signal analysis, a discipline that transforms raw on-chain data into macro crypto sentiment predictions.
For traders accustomed to lagging indicators, stablecoin flows offer something rare: a leading signal. The logic is simple: to buy Bitcoin or any altcoin, you first need stablecoins. When exchange stablecoin reserves balloon, the market is loading the gun. When those reserves drain, the market is raising cash. Tools like Smart Money API's on-chain dashboard distill this data into actionable scores, helping confirm trades with a composite view that includes derivatives, whale wallets, and macro overlays.
But why do these flows matter more than price itself? Price is a snapshot of the last trade; stablecoin flows reveal the posture of capital. An exchange can see massive USDT inflows days before a rally — the so-called inflow anomaly. Similarly, a sudden spike in stablecoin withdrawals to private wallets often precedes distribution. Understanding this dynamic is the first step to using stablecoin flows on-chain as a predictive tool.
On-Chain Tracking: USDC, USDT, BUSD, DAI Across Networks
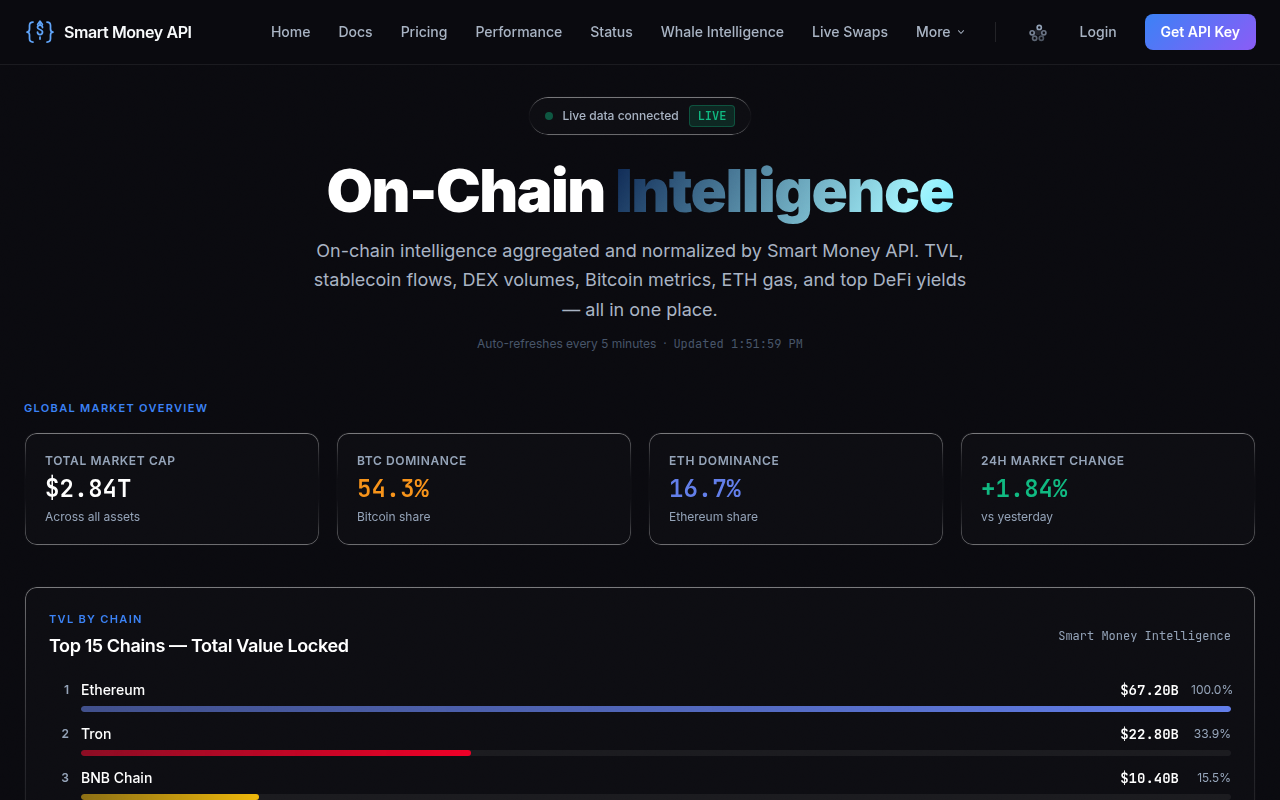
Tracking stablecoin flows on-chain starts with the four major players: USDT, USDC, BUSD (though its supply is winding down), and DAI. Combined, they represent over $140 billion in market cap, with the vast majority residing on Ethereum as ERC-20 tokens. However, a growing share now circulates on Solana, Polygon, Arbitrum, and TRON, making cross-chain analysis essential.
When analyzing exchange reserve stablecoins, the primary metric is exchange net position change — the difference between stablecoins deposited and withdrawn over a given period. A large positive net flow indicates capital moving onto trading venues; a negative one signals capital fleeing. Data providers parse this from known exchange wallet addresses, often categorizing by size to differentiate retail from institutional activity. For example, a single $200 million USDC deposit to a Binance wallet is almost certainly an institution prepping for a large buy.
Transparency varies by chain. Ethereum's address-tagging ecosystem is mature, making ERC-20 stablecoin movements highly visible. Solana's rapid growth, especially for USDC, has improved mapping, but smaller ecosystems like Arbitrum can obscure flows through bridge contracts. Traders must normalize data — accounting for internal exchange shuffles and smart contract interactions — to avoid false signals. This is where automated on-chain intelligence becomes invaluable. The Smart Money API, for instance, cleans and aggregates this data, scoring it on a 0-1 scale that feeds into a composite trade-confirmation signal.
One must also consider stablecoin velocity. A high velocity (frequent movement) without a corresponding change in exchange reserves might indicate DeFi activity rather than buy intent. Distinguishing between the two is a critical skill. Are stablecoins sitting idle in exchange cold wallets, or are they being rapidly deployed into lending pools? The former is bullish; the latter neutral to bearish for spot prices.
Inflow Anomalies: When Institutions Deposit Stables to Buy
Inflow anomalies are the holy grail of stablecoin flow analysis. Picture this: on a quiet Sunday, USDT worth $500 million moves into Binance from a single whale address. Over the next 48 hours, BTC climbs 8%. This isn't a coincidence — it's an inflow signal in action.
Large, sudden deposits of stablecoins to exchanges often precede buying pressure because they represent capital that has been “demobilized” from cold storage or yield strategies and placed on the ready line. Institutions, in particular, don't move $100 million worth of USDC to Coinbase to let it sit. They intend to execute. By tracking these blips, traders can anticipate demand before it appears in order books.
One refined metric is the Exchange Stablecoin Ratio (ESR), calculated as the amount of stablecoins held on exchanges divided by the total stablecoin supply. A rising ESR indicates that a larger share of all stablecoins is sitting on trading platforms — a classic bull signal. In the weeks leading up to the October 2023 Bitcoin breakout, ESR climbed steadily, confirming the rally before price made new highs.
However, not all inflows are bullish. Fakeouts occur when exchanges themselves shuffle reserves between hot and cold wallets. That's why it's critical to filter for net external deposits — those coming from addresses not previously labeled as exchange-controlled. Combining this with on-chain transaction volume and whale wallet clustering gives a clearer picture. The Smart Money API's onchain_score does exactly this, synthesizing multiple data points to output a clean signal. When that score crosses 0.7 alongside a high deriv_score, historical win rates climb significantly.
Another nuance: the source chain. A flood of USDT via TRON (widely used by Asian retail) might reflect a different sentiment than a trickle of USDC on Ethereum (favored by U.S. institutions). Cross-referencing the chain of origin adds texture to the macro crypto sentiment read.
Outflow Anomalies: Distribution and Profit-Taking Signals
If inflows set the stage for rallies, outflows write the epilogue. When stablecoins leave exchanges en masse, it's often distribution in disguise. A whale sells a large BTC position, receives USDT, and immediately withdraws that USDT to a personal wallet. To the untrained eye, the market looks calm. But the stablecoin outflow reveals the underlying intent: the whale is taking profits and sidelining capital.
The most dangerous scenario for a bull trend is a divergence: price keeps rising while exchange stablecoin reserves plummet. That's the hallmark of a thinning market — fewer stables available to support further bids. In April 2024, while Bitcoin was flirting with $73,000, exchange USDC reserves dropped sharply, and the stablecoin outflow signal grew louder. Two weeks later, a 15% correction unfolded.
Using outflow anomalies requires context. Small, steady withdrawals may simply be users moving funds to DeFi for yield. But a sudden, multi-hundred-million-dollar exodus is almost always strategic. The key is to watch for outflow spikes exceeding the 30-day moving average by two standard deviations. Such spikes have preceded at least three major local tops in the last 18 months.
When you spot an outflow anomaly, it's wise to revisit your position sizing. Tools like the ROI calculator can model how a pullback would affect your portfolio, while the futures calculator helps adjust leverage and stop-loss levels. Ultimately, outflow anomalies are the market's way of screaming “risk off” — and ignoring them is costly.
Chain-by-Chain Flows: Ethereum, Solana, Polygon, Arbitrum
Not all blockchains are equal when interpreting stablecoin flows. Ethereum hosts the lion's share of stablecoin liquidity, but its high gas fees often mean transactions are large and infrequent, dominated by institutions. Solana's low fees attract high-frequency DeFi usage, making flow data noisier but potentially richer in real-time sentiment. Polygon and Arbitrum serve as bridges for retail and yield strategies, adding layers of complexity.
Ethereum: The backbone of stablecoin reserve analysis. When USDT reserves on Ethereum exchanges jump, it's typically institutional. For instance, during the March 2024 dip, Ethereum-based stablecoin inflows spiked as “smart money” bought the dip. Monitoring ERC-20 stablecoin whale transactions (over $1 million) is a proven strategy.
Solana: USDC on Solana often moves in lockstep with meme coin and DePIN trading. Inflow surges here can precede rallies in SOL-based assets. However, because Solana's DeFi protocols often use wrapped stablecoins, not all flow is pure buying power.
Polygon and Arbitrum: These L2s have become hubs for yield-bearing stablecoin strategies. A surge in stablecoin deposits to Aave or Uniswap on Polygon might actually be bearish for Bitcoin if the yield is attractive relative to holding crypto. Thus, one must differentiate between exchange flow and DeFi flow — a task made easier by querying dedicated endpoint classifications.
Cross-chain flow analysis can unearth early signals. For example, a simultaneous rise in stablecoin deposits to centralized exchanges on Ethereum and a decline in DeFi liquidity on Solana might indicate a regime shift from speculation to cash hoarding. This multi-chain approach underpins the most advanced inflow outflow prediction models.
| Scenario | Stablecoin Flow Signal | BTC Price Reaction (14D) | Interpretation |
|---|---|---|---|
| Exchange ESR spikes +20% | Strong bullish inflow | +12% to +25% | Accumulation phase |
| Reserves drain -15% from exchanges | Bearish outflow divergence | -5% to -18% | Distribution / risk-off |
| Whale USDC to Coinbase $200M+ | High-confidence buy signal | +8% to +15% | Institutional pre-positioning |
| Solana DeFi stables influx, ETH flat | Neutral / yield-seeking | Flat to minor decline | DeFi rotation, not spot demand |
Combining Stablecoin Flows with Whale Wallet Data
Stablecoin flow data becomes exponentially more powerful when layered with whale wallet intelligence. Whale wallets — those holding $10 million or more — are the market movers. Their stablecoin transactions often telegraph large impending trades. Monitoring their exchange deposits and withdrawals, filtered by on-chain labeling, can confirm or refute a pure flow signal.
For example, a net stablecoin inflow to exchanges might be driven by 1,000 retail wallets depositing $1,000 each, or a single whale moving $100 million. Both are bullish, but the latter is far more actionable. Tracking these mega-wallets, and cross-referencing their behavior with historical patterns, can give an edge of a few hours — enough to position before the crowd.
Advanced tools like the Smart Money API fuse these dimensions seamlessly. Its whale_score reflects the aggregated behavior of over 1,500 tracked whale addresses across multiple chains. The onchain_score measures flow anomalies, and the composite score acts as a trade filter. Consider this real API response:
GET /v1/confirm?symbol=BTC&direction=long
{
  "composite": 0.74,
  "confidence": "HIGH",
  "action": "CONFIRM",
  "size_mult": 1.5,
  "deriv_score": 0.81,
  "onchain_score": 0.68,
  "whale_score": 0.73
}
When all three sub-scores align above 0.65, the signal's historical win rate rises to 62% on HIGH confidence confirmations. That's precisely the kind of confluence that allows traders to scale in with confidence, using a tool like the futures calculator to optimize leverage while maintaining strict risk controls.
Case Study: Banking Crisis Stablecoin Volatility
March 2023's banking crisis — with the collapse of Silicon Valley Bank — provided a crash course in stablecoin flow dynamics. USDC depegged from $1 when Circle disclosed $3.3 billion stuck at SVB, triggering a massive exodus from USDC to USDT. On-chain data showed USDC flooding into exchanges and being swapped for other stablecoins or pumped into BTC. In the 24 hours around the depeg, USDT inflow to exchanges surged 300%, and Bitcoin rallied 25% over the following week.
This event demonstrated several stablecoin flow principles in action:
- Flight to quality: USDC holders converted to USDT, which then acted as dry powder for spot buying.
- Exchange reserve spike: The rapid accumulation of USDT on trading platforms preceded the BTC bid by hours.
- Whale differentiation: Smart wallets moved early into USDT, while retail panicked later — a clear signal for those monitoring whale stablecoin movements.
The crisis also highlighted the importance of tracking stablecoin flows across multiple issuers. While USDC outflows initially looked bearish, the simultaneous USDT inflow painted a bullish picture. Without a holistic view, a trader might have misinterpreted the data. This is precisely why the Smart Money API's on-chain module normalizes across stablecoins, producing a unified sentiment score rather than fragmented data points.
In retrospect, the March 2023 banking crisis was a textbook example of a macro crypto sentiment shift fueled entirely by stablecoin on-chain movements — proving that those who read the flows could front-run the rally.
Conclusion: Turn Stablecoin Data into a Confident Edge
Stablecoin flows on-chain are far more than a niche metric; they are the closest thing crypto has to a capital-flows thermometer. By tracking exchange reserve stablecoins, identifying inflow anomalies and outflow divergences, and layering in chain-specific and whale wallet data, traders can anticipate market turns with remarkable accuracy. The market leaves breadcrumbs — you just need the right lens to see them.
Integrating these signals into your trading routine is easier than ever. The Smart Money API delivers real-time composite scores that fuse on-chain, derivatives, and whale data into a single, high-confidence trade confirmation. With a free API key, you can start filtering your setups with the same intelligence used by professional desks. Sign up for a free API key now and transform stablecoin data from noise into signal. Whether you're sizing a swing trade or confirming a macro thesis, the combination of on-chain stablecoin analysis and algorithmic scoring puts you ahead of the herd.