Regime vs. Noise: Defining Volatility States
The Two-Phase Crypto Market
Cryptocurrency markets rarely move in a straight line. Price action oscillates between long stretches of tight, low-volatility consolidation and explosive, high-volatility expansions that can double or halve an asset's value in days. Understanding these two fundamental states—volatility regimes—is the foundation of crypto volatility regime trading. Without a framework to distinguish regime from noise, traders risk being whipsawed during calm periods or caught offsides when volatility spikes.
A volatility regime is not a one-size-fits-all number. It is a contextual state defined by a cluster of metrics—realized volatility, options skew, ATR bands, funding rates, and order-book depth—that collectively signal whether the market is absorbing or distributing risk. In low-vol regimes, price tends to respect technical ranges, funding rates are neutral, and breakouts often fail. In high-vol regimes, trend momentum dominates, correlation across assets rises, and tail-risk hedges become essential.
Why Regime Detection Matters for Position Sizing
Recognizing which regime you are trading has direct consequences for your capital allocation. During low-vol consolidation, a trader might comfortably use leverage to capture small range swings, while in a high-vol breakout, the same leverage would lead to liquidation from a single adverse candle. Regime-aware sizing adjusts exposure dynamically, reducing drawdowns and preserving profits. This article equips you with a multi-factor approach to volatility regime detection—a "crypto VIX" built from on-chain, derivatives, and technical signals—so you can anticipate market shifts before they destroy your portfolio.
Measuring Realized Volatility: Historical vs. Implied
Calculating Realized Volatility
Realized volatility is the statistical standard deviation of logarithmic returns over a lookback period, usually annualized. For crypto, a 30-day rolling window captures recent regime shifts without too much lag. The formula: Realized Volatility = σ × √365 (for daily returns), where σ is the standard deviation of log returns. A reading below 40–50% annualized often marks low-vol consolidation, while above 80% signals high-vol expansion—typical for major altcoins or post-event moves.
Tracking realized volatility alone, however, can miss the forward-looking nature of market fear. That's where implied volatility steps in. Options markets price future volatility expectations, and the gap between implied and realized—the volatility risk premium—often widens ahead of regime transitions. When implied vol outruns realized vol, traders are paying for protection, hinting that a volatility expansion may be brewing.
Implied Volatility and the Heatmap Insight
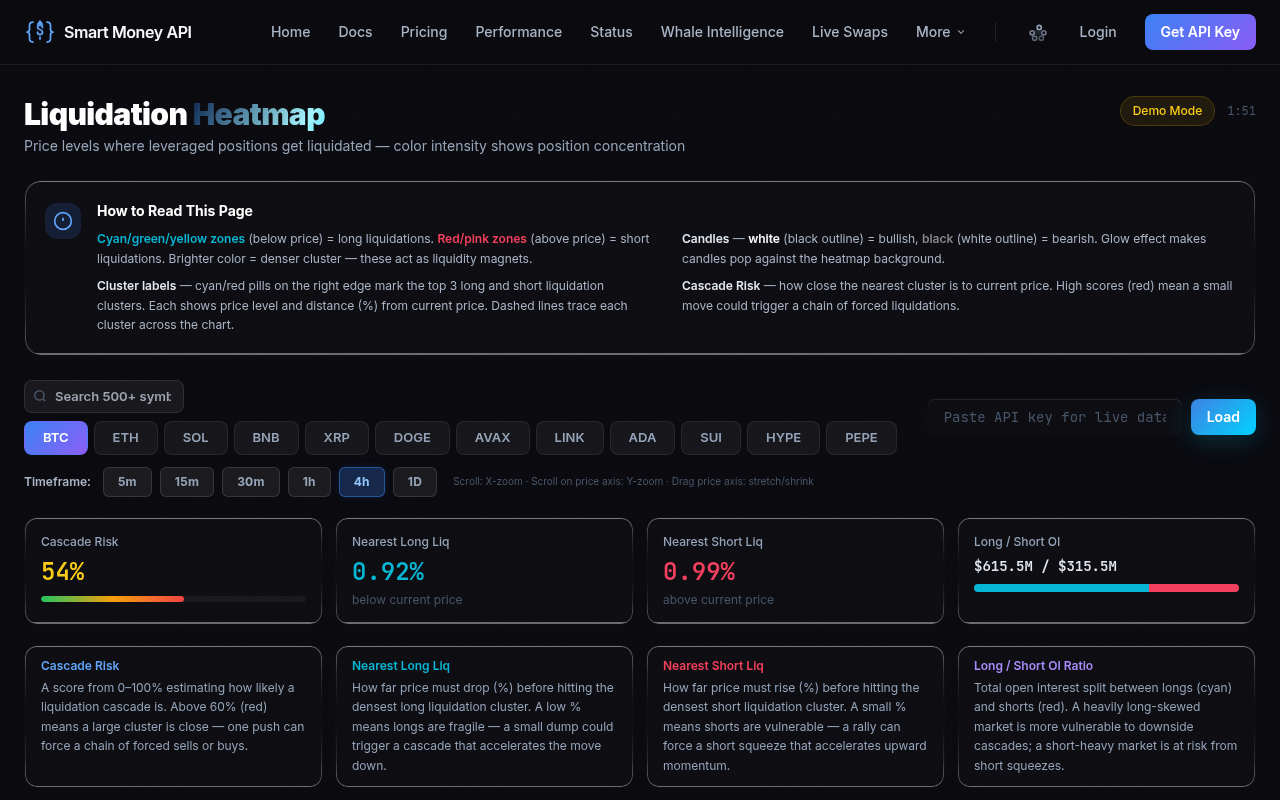
Deribit's BTC and ETH options chains offer at-the-money implied volatility indices that act as crypto's VIX. But for a consolidated view across assets and timeframes, a multi-asset heatmap can reveal where vol is clustering. For instance, when smart-money wallets start hedging heavily while derivatives open interest spikes, a regime shift is likely near. Tools that aggregate these signals—like the heatmap dashboard of Smart Money API—provide a visual cue of rising volatility conditions across the market. Below, you can see an example of how concentrated volatility patterns appear before major moves.
Monitoring both realized and implied volatility gives a baseline regime detection framework, but it still lacks an important dimension: skew. The shape of the volatility smile reveals asymmetric market expectations, which is critical for catching crash regimes.
Options Skew and Tail Risk: When Markets Fear Crashes
Understanding Put/Call Skew
Options skew measures the premium of out-of-the-money puts versus equivalent calls. In equities, a persistent put skew exists because investors hedge downside risk. In crypto, skew can flip violently. A rising 25-delta risk reversal (difference between implied volatility of 25-delta puts and calls) signals fear of downside tail events. When this metric jumps above 5–10% in favor of puts, the market is pricing in a crash—often a precursor to a high-vol regime.
During the May 2021 selloff, BTC's 25-delta skew surged from near zero to over 15% within hours, marking the transition from a low-vol sideways drift to a full-blown liquidation cascade. Volatility regime detection that ignores skew would have been late to the party.
Skew as a Leading Regime Indicator
Skew is not just a stat; it's a live signal of the balance between fear and greed. When skew is flat or even calls are more expensive (a "call skew"), the market is complacent—typical of low-vol consolidation regimes. When put skew spikes, that's the regime shift alarm. Combined with a sudden widening of bid-ask spreads and an uptick in on-chain exchange inflows, skew confirms that high-vol is arriving. This fusion of derivatives data is exactly where multi-factor models excel.
ATR Bands and Breakout Zones Across Volatility Regimes
Setting ATR-Based Regime Thresholds
Average True Range (ATR) captures instantaneous volatility in price terms. Unlike realized volatility which is backwards-looking and annualized, ATR adapts quickly. A 14-period ATR expressed as a percentage of price provides a robust on-chart regime filter. When ATR% falls below 3–4% on a daily chart, the market is in a low-vol regime; above 7–8%, it's high-vol. The table below summarizes key metrics for each regime.
| Regime | Realized Vol (30d) | ATR/Price (14d) | Options Skew | Funding Rate | Position Sizing |
|---|---|---|---|---|---|
| Low-Vol Consolidation | < 45% | < 4% | Near zero, slight call bias | Neutral or slightly positive | Standard, scale into range |
| Transition / Warning | 45–70% | 4–6% | Puts starting to bid up | Turning negative | Reduce size, tighten stops |
| High-Vol Breakout | > 70% | > 6% | Significant put skew (>5%) | Strongly negative | Small position, wide stop |
These thresholds are not rigid; they adapt to asset and market conditions. For BTC, a 6% ATR indicates chaos; for a low-cap altcoin, that might be normal. The key is relative change.
Breakout Confirmation with ATR Multiples
An ATR regime shift is most actionable when price violates a multiple of ATR beyond a range. For example, a close above the 20-day high + 1.5 ATR often confirms a volatility expansion. Traders can then switch from mean-reversion strategies to trend-following. Using an futures calculator to determine contract size in this new regime ensures you don't overcommit during a potentially whippy breakout.
Combining Regime Signals with Funding Rates
The Interaction Between Regime and Perpetual Funding
Perpetual futures funding rates are a real-time sentiment and leverage thermometer. In low-vol regimes, funding tends to hover near zero or slightly positive because directional conviction is low. When funding flips negative—meaning shorts are paying longs—and ATR is simultaneously climbing, it signals that a high-vol short-squeeze or momentum cascade could unfold. Conversely, extremely high positive funding during a low-vol regime often precedes a sudden regime switch as overleveraged longs get flushed.
Integrating funding rates into your regime filter adds a leverage layer to the volatility story. The real power comes when you combine all factors—realized vol, skew, ATR, funding—into a single composite. And that's where external confirmation APIs can sharpen your edge.
Building a Multi-Factor Regime Score
Instead of eyeballing five different charts, you can construct a normalized score (0 to 1) aggregating each metric's deviation from its baseline. A score > 0.7 indicates a high-confidence high-vol regime. For instance, the following API call to Smart Money API's confirm endpoint delivers a composite trade-confirmation score that fuses derivatives, on-chain, and whale wallet data:
GET /v1/confirm?symbol=BTC&direction=long
{
  "composite": 0.74,
  "confidence": "HIGH",
  "action": "CONFIRM",
  "size_mult": 1.5,
  "deriv_score": 0.81,
  "onchain_score": 0.68,
  "whale_score": 0.73
}
Here, a composite of 0.74 with high confidence confirms the regime transition. The deriv_score of 0.81 reflects options skew and funding anomalies, while the onchain_score captures exchange netflows and miner activity. This kind of multi-factor synthesis helps avoid false signals and ties regime detection directly to trade sizing.
Position Sizing Adjustment Across Regimes
Low-Vol Regime: Scaling In with Reduced Leverage
When volatility is suppressed, mean-reversion and range-trading strategies perform best. But even then, risk of a sudden expansion lurks. Position sizing should be calibrated to a stop distance that allows for routine noise while respecting the range boundary. Using a leverage calculator with a 1.5× or 2× leverage keeps exposure modest. If you're accumulating, scale in over several days, and use a volatility-based stop (e.g., 1.5 × ATR from entry).
In such regimes, a size_mult of 1.0 (as the API above sometimes returns) is appropriate, because the probability of a regime shift is still non-zero. Keeping dry powder for when the breakout arrives is the hallmark of a skilled volatility-conscious trader.
High-Vol Regime: Sizing Down and Tight Stops
During a high-vol expansion, the risk of ruin skyrockets. The same move that would be three ATR in a calm market can become five or ten ATR in a few hours. Position size must be cut. If your standard risk per trade is 2% of capital, reduce it to 0.5–1% in high-vol. Additionally, widen stop-losses in price terms—because volatility itself is larger—but ensure that the dollar risk remains capped. A futures calculator can quickly compute the correct contract quantity based on the inflated ATR percentage stop.
Furthermore, the API's size_mult field (1.5 in the example) provides a ready-made guidance: when the model detects high conviction in a high-vol regime, it suggests increasing position size from a pre-established base, but that base should already be conservative for the volatile state. Never ignore the size_mult when transitioning—it's a signal to adjust, not to blindly follow without context.
Trading Example: Post-Halving Volatility Expansion
Let's illustrate the entire framework with a concrete scenario. In April 2024, following Bitcoin's fourth halving, the market entered a prolonged low-vol regime. Realized vol dropped to 35%, ATR hovered around 2.5%, and options skew was flat. Many traders grew complacent. Then, about 100 days post-halving, a divergence appeared: skew started gently tilting toward puts, funding rates turned slightly negative on BitMEX, and on-chain exchange inflows began to tick up. The multi-factor regime score crawled from 0.3 to 0.55. The composite was not yet shouting "breakout," but Smart Money API's confirm endpoint showed a deriv_score of 0.72, suggesting that derivatives traders were positioning for a move.
Within two weeks, Bitcoin broke above a stubborn resistance with a 1.8 ATR daily close. Realized volatility spiked past 70%, funding turned deeply negative, and the options skew exploded to +12% put premium. The regime had shifted. Traders who had stayed vigilant and used a volatility regime detection framework were ready: they cut position sizes, rode the trend with wide stops, and used the futures calculator to keep their leverage at 2× maximum, protecting capital from the inevitable snapback. Low-vol accumulators who ignored the signals got caught overleveraged and were wiped out on the first 15% flash crash.
Conclusion: From Detection to Decision
Building a personal crypto VIX is within every trader's reach. By combining realized volatility, options skew, ATR bands, and perpetual funding rates, you create a robust volatility regime detection system that separates signal from noise. The real edge, however, comes from synthesizing these signals into an actionable composite—something that Smart Money API already does in a single call. The free tier gives you instant access to the heatmap, confirmation scores, and whale tracking, helping you react to regime shifts before they become obvious.
Ready to stop trading blind? Sign up for a free API key and start incorporating multi-factor regime signals into your crypto volatility regime trading strategy today.