What Are Funding Rates? Funding vs. Mark Price
Before you can use funding rates as entry signals, you need to understand exactly what they are and why they exist. Funding rates are periodic payments exchanged between long and short position holders in perpetual futures markets. Unlike traditional futures contracts that expire on a set date, perpetual swaps have no expiry. To keep the perpetual contract price tethered to the underlying spot price, exchanges use a funding mechanism that incentivizes traders to balance the market.
Every funding interval—typically 8 hours on major exchanges like Binance, Bybit, and OKX—a payment flows from one side of the market to the other. When the perpetual contract trades above the spot price (a premium), longs pay shorts. When it trades below spot (a discount), shorts pay longs. The payment is proportional to position size and the funding rate percentage at that moment.
It is crucial to distinguish the mark price from the last traded price. The mark price is an exchange-calculated fair value—typically a composite of spot index prices across multiple liquidity sources—used to determine unrealized PnL and liquidations. Funding rates are calculated using the difference between the mark price and the spot index price, not the last traded price. This prevents manipulation of funding by painting the tape on illiquid order books. If you are calculating position sizes manually, use our futures calculator to model liquidation distances and funding costs accurately under different rate scenarios.
The funding rate formula most exchanges follow is:
Funding Rate = Clamp( (Mark Price - Spot Index) / Spot Index, -0.375%, 0.375% ) + Clamp( Premium / Spot Index, -0.05%, 0.05% )In practice, funding rates rarely hit these caps. A "normal" funding rate on BTC hovers around 0.01% per 8-hour window—roughly 10.95% annualised if sustained. When rates deviate significantly, they become powerful signals. Understanding this mechanic is step one. Step two is learning to read what the direction and magnitude tell you about market positioning.
Reading Funding Direction: Bullish (Negative) vs. Bearish (Positive)
Funding rate direction reveals who is paying whom—and that tells you which side of the market is overcrowded. The rule is straightforward but counter-intuitive for beginners:
- Negative funding rate: Shorts pay longs. This means there are more aggressive shorts than longs, and the perpetual contract trades at a discount to spot. The market is bearish in positioning but this creates a bullish structural bias because shorts are being penalised every 8 hours. Holding a long position during sustained negative funding effectively earns you yield.
- Positive funding rate: Longs pay shorts. There are more aggressive longs, the contract trades at a premium, and the market is bullish in positioning with a bearish structural bias. Longs bleed funding every interval, which creates selling pressure over time.
The key insight is that funding direction is a contrarian signal at extremes and a confirming signal in moderation. When funding is modestly positive (0.01%–0.03%), it simply confirms bullish momentum. When it spikes above 0.1% or drops below −0.1%, it signals an overcrowded trade ripe for reversal.
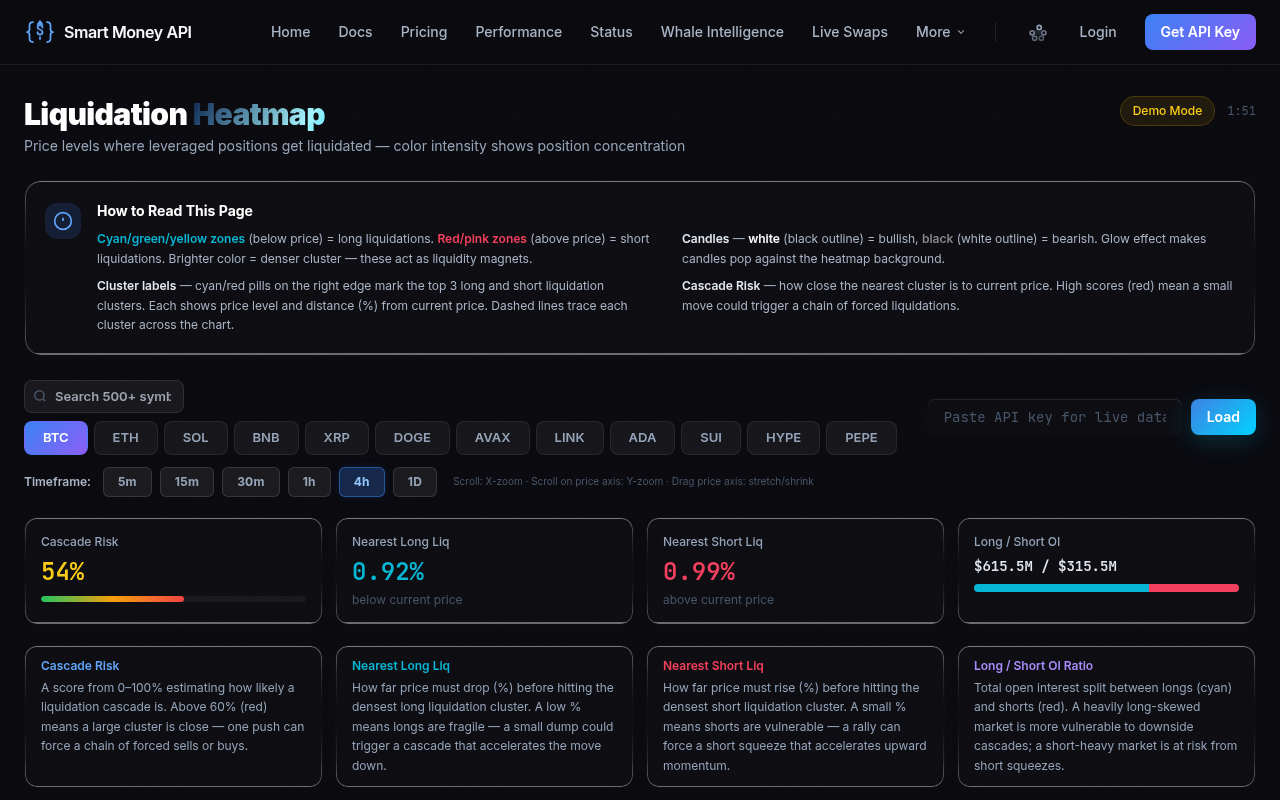
To put numbers in perspective: a 0.1% funding rate every 8 hours compounds to roughly 109.5% annualised cost for the paying side. No rational trader holds a position leaking that much without a correspondingly large directional conviction. That conviction, when it breaks, causes violent unwinds. Tools like the Smart Money API heatmap aggregate funding rates across exchanges and overlay them with whale wallet activity and on-chain flows, giving you a composite view of whether extreme funding is backed by genuine accumulation or is a trap waiting to spring.
Predicting Reversals: When Funding Extremes Flip
Extreme funding rates do not cause reversals by themselves—they create the conditions for reversals by making one side of the trade increasingly expensive to maintain. A funding flip occurs when the rate crosses from deeply negative to neutral or positive (or vice versa), and these flips often coincide with significant price inflection points.
Here is how to spot a pending reversal using funding data:
- Identify the extreme. Look for funding rates exceeding ±0.1% on the 8-hour interval. On highly liquid pairs like BTC/USDT, anything above 0.08% is noteworthy. On altcoins, thresholds are wider—0.15% to 0.3% is common during euphoric rallies.
- Check the duration. A single extreme funding print is noise. Sustained extreme funding across 3+ consecutive intervals (24+ hours) means the crowded side is haemorrhaging capital. The longer the extreme persists, the more coiled the spring.
- Watch open interest. If funding is extremely positive and open interest is flat or declining, longs are already unwinding—the reversal may be underway. If OI is still rising, the blow-off top may still have room to run, but risk is asymmetric to the downside.
- Monitor the funding rate trend. Is the absolute rate getting smaller while price holds? That is absorption—the weaker hands on the crowded side are being shaken out, and stronger hands are stepping in on the other side. This compression precedes expansion.
- Look for a catalyst. The flip itself often coincides with a spot-driven move. A large spot market buy during negative funding can liquidate shorts and flip the rate positive within a single interval, trapping late shorts.
The most reliable reversal pattern is extreme funding + divergence. Price makes a higher high but funding makes a lower high—fewer traders are willing to pay premium to stay long. That divergence is your early-warning system. The Smart Money API quantifies this through its derivative scoring module, which weights funding extremes against order-book depth and liquidation clustering to produce a single deriv_score.
Entry Strategy 1: Buy at Negative Funding (Counter-Trend)
Buying into negative funding is a counter-trend strategy that exploits the structural yield paid by shorts. When funding is deeply negative, the market is pricing in further downside, but the cost of shorting creates a time decay that works in the long's favour. This strategy works best during corrections within a broader uptrend, not during full-scale bear markets where negative funding can persist for weeks.
Step-by-Step Procedure
- Define the higher-timeframe trend. On the daily chart, confirm that the asset is above its 200-day moving average or a key on-chain cost-basis level. You are looking for a pullback within a bull trend, not a collapsing structure. If the HTF trend is bearish, skip this strategy entirely.
- Wait for funding to turn negative. Monitor the 8-hour funding rate. A reading of −0.05% or lower (more negative) warrants attention. At −0.1%, the signal strengthens considerably. Use a funding rate aggregator or the exchange's API to set alerts.
- Check for capitulation volume. Look for a high-volume sell-off on the 4-hour or 1-hour chart. The ideal setup is a sharp wick down on elevated volume coinciding with the negative funding print—this is short-term seller exhaustion.
- Identify a support level. The entry should be near a structural support: a previous swing low, a high-volume node from the volume profile, or a liquidity cluster visible on the order book. Do not enter blindly just because funding is negative.
- Scale in with two tranches. Enter 50% of your intended position at the support level. Place a limit order for the remaining 50% slightly below—perhaps at the next liquidity pocket—in case of a final flush. This averages your entry and reduces the pain of a premature fill.
- Set your stop-loss below the recent low. The invalidation point is a clean break of the swing low that formed during the negative funding episode. If price takes out that low, the counter-trend thesis is broken.
- Take profit at the mean-reversion target. The first target is the midpoint of the sell-off range. The second target is the range high. Move your stop to breakeven once the first target is hit.
This strategy benefits from the funding yield while you wait. At −0.1% per 8 hours, a long position earns approximately 0.3% per day just from funding payments. Over a week, that is a 2.1% buffer against adverse price movement—a structural edge that compounds.
Entry Strategy 2: Sell at Positive Funding (Trend-Following)
Selling into positive funding is structurally different from buying into negative funding. While negative funding longs are counter-trend (fading the short-term move), positive funding shorts can be either trend-following or counter-trend depending on context. The most reliable application is trend-following: using extreme positive funding to confirm that a trend is overextended and due for a sharp correction, then shorting the breakdown.
Step-by-Step Procedure
- Identify a mature uptrend. The asset should have rallied significantly—30% or more in a short period—with minimal pullbacks. Parabolic structure on the 4-hour chart is ideal. Funding should be consistently positive and rising.
- Wait for the funding extreme. A funding rate above 0.1% per 8-hour interval signals that longs are paying a heavy premium. On altcoins, this threshold can be 0.2% or higher. The extreme signals overcrowding.
- Look for a bearish structure break. Do not short purely on the funding signal. Wait for price to break below a trendline, a key moving average (e.g., the 21-period EMA on the 4-hour chart), or a prior swing low. The funding extreme provides the context; the structure break provides the trigger.
- Confirm with funding-rate decline. After the structure break, watch the next funding interval. If the rate drops sharply—from 0.15% to 0.03%, for example—it confirms that longs are rushing for the exit. This is your green light.
- Enter on a retest. After the breakdown, price will often retest the broken level. Enter your short on this retest, placing your stop-loss above the recent swing high.
- Manage the trade actively. Unlike the negative-funding long strategy, you are not earning funding yield as a short during positive funding—you are paying it. This means time decay works against you, so you need a faster move. If the breakdown does not follow through within 2–3 funding intervals, reduce or exit the position.
- Take partial profits at support levels. Scale out 30–40% at the first major support, another 30% at the next, and let the remainder run with a trailing stop.
This strategy works because extreme positive funding reflects leveraged euphoria. When the music stops, the unwind is violent as over-leveraged longs get liquidated in cascades. Your short profits from both the price decline and the squeeze on late longs.
Position Sizing: Size Bigger When Funding Is Extreme
Funding rate extremes do not just tell you which direction to trade—they also inform how much to risk. When funding reaches an extreme, the probability of a mean-reverting move increases, and the structural edge (from funding yield or impending liquidations) justifies larger position sizes within your risk framework. The table below outlines a tiered approach to position sizing based on funding rate percentiles.
| Funding Rate (8h) | Percentile | Signal Strength | Suggested Size Multiplier | Rationale |
|---|---|---|---|---|
| −0.01% to +0.01% | 40th–60th | Neutral | 1.0× (baseline) | No structural edge; use standard position sizing from your leverage calculator. |
| −0.05% to −0.01% or +0.01% to +0.05% | 25th–40th or 60th–75th | Mild | 1.0–1.2× | Slight positioning skew; worth a modest overweight if other signals align. |
| −0.10% to −0.05% or +0.05% to +0.10% | 10th–25th or 75th–90th | Strong | 1.3–1.5× | Clear overcrowding; funding yield or squeeze potential provides quantifiable edge. |
| Below −0.10% or above +0.10% | <10th or >90th | Extreme | 1.5–2.0× | Rare conditions; historically high reversal probability. Increase size but tighten stops. |
Size multipliers are applied to your standard risk unit—the dollar amount you normally risk per trade. If your baseline risk is $500 (1% of a $50,000 portfolio) and funding is at −0.12%, a 1.5× multiplier means risking $750 on the trade. Crucially, you achieve this by widening your position size not by widening your stop-loss. The stop remains at the technical invalidation level; only the notional exposure increases.
This is where composite confirmation tools become invaluable. Rather than sizing up on funding alone, you can cross-reference the funding signal with on-chain accumulation and whale activity. The Smart Money API returns a size_mult field directly in its response, calculated from the interaction of derivatives, on-chain, and whale scores:
GET /v1/confirm?symbol=BTC&direction=long
{
  "composite": 0.74,
  "confidence": "HIGH",
  "action": "CONFIRM",
  "size_mult": 1.5,
  "deriv_score": 0.81,
  "onchain_score": 0.68,
  "whale_score": 0.73
}
When the composite score exceeds 0.7 with HIGH confidence and a size_mult of 1.5, you have a statistically validated reason to overweight the trade. The 62% win rate on HIGH-confidence signals from the API provides a meaningful edge over discretionary funding-rate interpretation alone. The deriv_score of 0.81 in this example reflects extreme funding combined with favourable liquidation clustering—exactly the conditions we have described.
Live Example: A BTC Funding Cycle
Let us walk through a realistic Bitcoin funding cycle to see how these strategies play out in practice. The following example is based on typical BTC behaviour during a rally-correction-resumption pattern, compressed into a two-week window for clarity.
Day 1–3: The Rally. BTC rallies from $62,000 to $68,000 over three days. Funding rates are moderately positive, oscillating between 0.02% and 0.05% per 8-hour interval. This is healthy—longs are paying a reasonable premium, and open interest is rising in line with price. No action yet; the trend is intact.
Day 4–5: Euphoria. BTC breaks $70,000 and retail FOMO kicks in. Funding spikes to 0.12%, then 0.18%. Open interest hits an all-time high. The 8-hour funding payments on a $100,000 long position are now $180 every interval—$540 per day. This is unsustainable. The deriv_score on the Smart Money API drops as the funding extreme flashes warning. Traders using Entry Strategy 2 begin watching for a structure break.
Day 6: The Breakdown. BTC fails to hold $70,000 and closes a 4-hour candle below the 21 EMA. The next funding interval prints 0.04%—a sharp decline from 0.18%. Longs are unwinding. The setup triggers: extreme funding preceded a structure break, and the funding decline confirms the exit. Shorts are entered on the retest of $69,500 with a stop above $71,000. Over the next 36 hours, BTC drops to $64,000, filling the first and second profit targets.
Day 7–9: The Correction Deepens. BTC touches $62,000. Funding flips negative—first −0.02%, then −0.08%. The market is now pricing in further downside, and shorts are piling on. But the higher-timeframe trend (200-day MA at $58,000) remains bullish. This is the setup for Entry Strategy 1. Traders identify the $62,000 level as a high-volume node from the earlier consolidation.
Day 10: The Entry. A wick to $61,200 on elevated volume coincides with a −0.11% funding print. The capitulation signal fires. Longs are scaled in: 50% at $61,500, another 50% limit at $60,800 (which fills on the wick). Average entry: $61,150. Stop-loss at $59,800 (below the recent swing low). The funding yield at −0.11% is paying approximately 0.33% per day to hold the position.
Day 11–14: The Recovery. BTC stabilises and begins recovering. Funding normalises to −0.01%. The first profit target at $64,000 (the midpoint of the sell-off) is hit on Day 12. Half the position is closed, the stop on the remainder is moved to breakeven. By Day 14, BTC reclaims $67,000 and the second tranche is closed. Total return: approximately 9.6% on the long position plus 1.3% in funding yield over four days.
This cycle illustrates the rhythm: positive funding extremes precede corrections, negative funding extremes precede bounces. Neither signal works in isolation—both require structural confirmation and disciplined risk management. The composite approach, integrating funding, on-chain data, and whale tracking through a unified score, removes the guesswork from timing these flips.
Start Using Funding-Based Entry Signals Today
Funding rates are one of the most transparent, real-time sentiment indicators available to futures traders—and they are completely free to monitor. By understanding funding direction, recognising extremes, and applying the two entry strategies outlined above, you can shift from reactive trading to anticipatory positioning. The key is consistency: check funding rates before every trade, track them across multiple intervals, and never enter a position without knowing which side is paying the premium.
To accelerate your learning curve and remove subjectivity from the process, integrate a composite confirmation system. The Smart Money API fuses derivatives data (including funding rates and liquidation levels), on-chain metrics, and whale wallet tracking into a single trade-confirmation score. With a 62% win rate on HIGH-confidence signals and a free tier to get started, it is the natural next step for traders serious about funding-rate strategies. Sign up for a free API key and start validating your entries with institutional-grade data today.