What is a Liquidation Heatmap? Visualizing On-Exchange Leverage
A liquidation heatmap is a visual chart that overlays cumulative liquidation levels of open leveraged positions directly on a price chart. Every time a trader opens a long or short position with borrowed funds, the exchange calculates a liquidation price—the point where the position will be forcibly closed to prevent losses beyond the margin. When thousands of traders pile into similar price levels, these liquidation prices cluster into dense horizontal bands. A liquidation heatmap makes those clusters instantly visible, revealing where the market’s highest-leverage bets are most vulnerable.
On major crypto derivatives exchanges like Binance, Bybit, OKX, and Bitget, heatmaps aggregate both long and short liquidations. The y‑axis maps price levels; the x‑axis often displays estimated liquidation notional value, or the heatmap simply uses color intensity to convey magnitude. The more collateral that sits at a given level, the larger and brighter the indicator becomes. This turns the chart into a real‑time map of potential forced sell‑offs and short squeezes. Market makers and algorithmic traders routinely hunt these liquidity pools, because they know that a breach of a dense zone can trigger a cascade—a self‑reinforcing wave of liquidations that accelerates price in the breakout direction. For a savvy trader, reading a heatmap correctly therefore offers an edge in predicting where explosive moves might ignite. Tools like Smart Money API's intelligent heatmap go a step further by cross‑referencing cluster data with on‑chain flow, whale wallets, and macro sentiment to provide a composite confirmation score, essentially turning raw liquidation geography into an actionable trade signal.
Reading Heatmaps: Color-Code, Density, and Threshold Levels
Every heatmap platform uses a color scale to represent density, although conventions can vary slightly. Most follow a traffic‑light gradient: red (or deep crimson) marks the highest concentration of leveraged liquidation notional, orange the next tier, yellow a moderate zone, and blue/green low‑density areas. The thickness of each horizontal bar is also a clue. A thick, blazing‑red band at $70,000 on BTC/USDT indicates that hundreds of millions of dollars in leveraged positions (likely shorts, if above price) would be liquidated if that level is breached. A thinner, pale‑yellow line at $69,200 might represent a minor cluster that could be chewed through quickly.
When reading a heatmap, pay attention to the threshold levels—the exact price where a cluster begins and ends. Many exchanges allow you to set a minimum notional filter (e.g., show only zones above $10M). This declutters the chart and lets you focus on institutional‑grade liquidity. Also note that density is not static; positions are opened and closed constantly, so the heatmap evolves with the order book. On a 15‑minute or 1‑hour bin, you can spot build‑ups before a breakout. In a trending market, the heatmap might show new red zones being constructed ahead of price, a sign that leveraged traders are adding to winners—or fighting the trend.
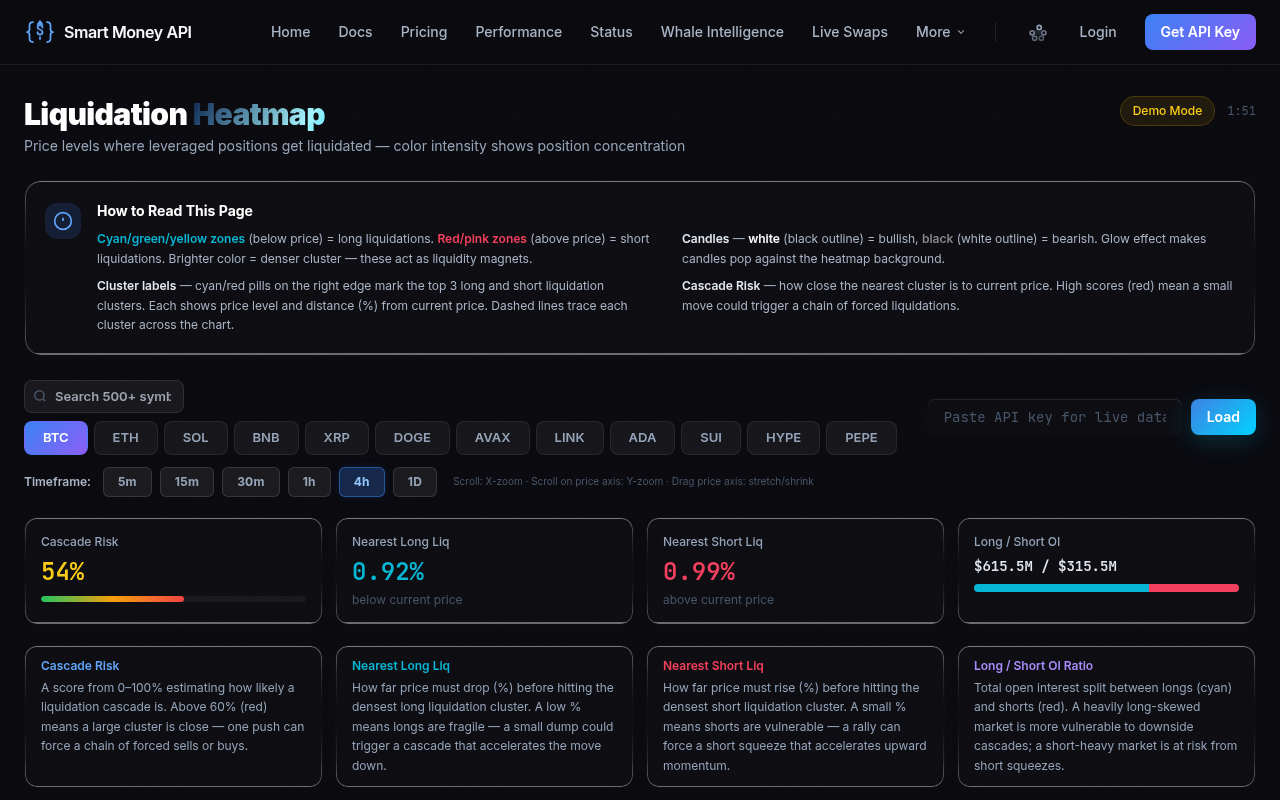
For traders who integrate system‑wide data, the Smart Money API provides a confirmation layer. While a heatmap shows where liquidation fuel sits, the API’s composite signals tell you whether whales and on‑chain metrics support a directional move. Here is a sample trade‑confirmation response:
GET /v1/confirm?symbol=BTC&direction=long
{
  "composite": 0.74,
  "confidence": "HIGH",
  "action": "CONFIRM",
  "size_mult": 1.5,
  "deriv_score": 0.81,
  "onchain_score": 0.68,
  "whale_score": 0.73
}
A composite score of 0.74 with a HIGH confidence means that derivatives metrics, on‑chain flows, and whale wallets are all leaning bullish. When this aligns with a massive short‑liquidation cluster above price, the probability of a breakout squeeze rises markedly. The size_mult field even suggests a factor for position sizing, taking into account the estimated cascade depth.
Step 1: Identify High-Density Zones (Red/Orange Areas)
Before any trading decision, you need to map the battlefield. The most critical levels are the red and orange heatmap bands. Those represent the largest pools of “forced” orders waiting to be executed. Ignoring them is like driving blindfolded through a minefield. Follow these steps to extract high‑priority zones:
- Open the liquidation heatmap for your target pair (e.g., BTC/USDT) on a medium‑timeframe view—15‑minute or 1‑hour bins work best for swing and breakout traders. Higher timeframes show more structural liquidity.
- Look for the thickest red/orange horizontal bars above and below the current price. These are the highest‑density zones. Note their exact price levels—say $65,800 for a short‑liquidation cluster and $63,100 for a long‑liquidation cluster.
- Assess whether the clusters sit near traditional technical levels (prior swing highs, lows, VWAP deviations, or Fibonacci retracements). A red band that coincides with a key resistance increases the likelihood of a violent reaction if hit.
- Check the color intensity over time. If a zone is growing redder on each candle, it means leveraged traders are adding to their positions at that level, essentially “stacking the gas can.” Conversely, fading color suggests the cluster is being dismantled by manual closes or hits.
- Mark these zones on your chart as liquidation support (below price, protecting longs) and liquidation resistance (above price, capping shorts). These are not traditional S/R but liquidity‑based magnets that often trigger price reversals or breakouts.
Step 2: Estimate Cascade Trigger Points
Not every dense cluster will ignite a cascade. You need to gauge the pre‑conditions that make a trigger point likely. A cascade typically begins when price breaches a minor cluster, gathers momentum, and then slams into a major red zone. Estimating where that chain reaction starts lets you anticipate the breakout before the crowd.
- Identify the nearest medium‑density zone (orange/yellow) in the direction of the prevailing trend or a building price structure. For an upward breakout, look for the first yellow‑orange band above price; for a breakdown, below.
- Measure the distance from the current price to that cluster. A tight proximity (less than 0.5% in high‑volatility assets like BTC) suggests a touch is imminent. If the cluster is far away, you may need a catalyst—news, funding‑rate reset, or large spot orders—to bridge the gap.
- Observe the slope of recent price action. A series of higher highs moving with decreasing volume that approaches the cluster often indicates a slow grind. When the grind accelerates on increasing volume, the probability of a cascade triggering rises sharply.
- Check if there is a low‑density (blue/green) gap just before the big red zone. These gaps act like an air pocket: the market moves through them almost frictionlessly, building kinetic energy before hitting the dense liquidity wall. The wider the low‑density gap, the more momentum the price can gather.
- Estimate the potential cascade depth. A red zone worth $200M in liquidations can easily push price another 1‑2% beyond the cluster as stop‑market orders flood the book. Factor this into your profit targets and stop placements so you aren’t run over by the overshoot.
Step 3: Size Positions Accordingly
Heatmap analysis is pointless if your position gets liquidated by the very zone you’re watching. The key is to position‑size and set stops using the heatmap as a risk map. Use these steps to align your trade with liquidation geography.
- Determine the nearest high‑density zone that would be hostile to your position. For a long entry, this is the major long‑liquidation cluster below price; for a short, it’s the short‑liquidation cluster above. That is your “danger level.”
- Use a liquidation calculator to compute your exact liquidation price based on entry, leverage, and margin mode (isolated/cross). Make sure your liquidation price is at least 0.3–0.5% away from the danger level. For high‑volatility scalp, increase that buffer.
- Run the numbers through a leverage calculator to find the appropriate leverage multiple that keeps you safe. If the distance between your entry and the hostile cluster is small, reduce leverage—moving from 10x to 5x could be the difference between staying alive and being wiped.
- Set a hard stop‑loss just beyond the first low‑density zone behind the cluster. For example, if you are long and the major red long‑liquidation band sits at $63,200, place your stop at $63,050, where the heatmap shows minimal liquidity. This avoids the cascade vacuum.
- Set price alerts at the cluster’s boundary. When the market approaches the red zone, you can decide to scale out, tighten stops, or prepare for a breakout entry depending on your plan. Automation tools or an API like Smart Money can trigger notifications when price nears the mapped danger levels.
Advanced: Comparing Heatmaps Across Exchanges
Experienced traders don’t rely on a single exchange’s liquidation data. Because Binance might have a different leverage cap and user base than Bybit or OKX, the heatmap profile can vary significantly. A short‑liquidation cluster that looks moderate on one exchange might be massive on another, especially if a single whale loaded up leverage on a less‑liquid venue. Cross‑exchange comparison reveals the true systemic risk.
The table below outlines a hypothetical scenario for BTC/USDT across three exchanges, with estimated liquidation notional at a key level of $66,000:
| Exchange | Max Leverage | Cluster Density at $66K | Estimated Notional | Risk of Isolated Cascade |
|---|---|---|---|---|
| Binance | 125x | Red (very high) | $180M (shorts) | Very high if breached |
| Bybit | 100x | Orange (high) | $70M (shorts) | Moderate, but can fuel Binance move |
| OKX | 100x | Yellow (moderate) | $35M (shorts) | Low alone, but adds to total |
Aggregating these, a total of $285M in short liquidations sits at $66,000. That’s a massive liquidity magnet. While individual exchange heatmaps give you a partial view, a tool like the Smart Money API’s composite data stream merges multiple exchange feeds with on‑chain and whale wallet information, so you can see the full liquidation landscape without toggling between dashboards. When the API’s deriv_score rockets above 0.8 at the same time as a multi‑exchange cluster matures, you have a high‑conviction signal for an imminent cascade.
Live Example: A Breakout with Liquidation Cascade
Let’s walk through a real‑world setup that many traders can recognize. BTC/USDT is trading at $64,500. The 1‑hour liquidation heatmap on Binance shows a gargantuan red short‑liquidation zone at $65,600, representing an estimated $250M in short positions. Below price, a modest orange long‑liquidation cluster rests at $63,800. The immediate upside appears thin—a blue gap from $64,700 to $65,300—meaning any small spark could propel price through a frictionless corridor straight into the red zone. Funding rates are slightly negative, and the Smart Money API returns a HIGH confidence long confirmation with a composite of 0.71. Here’s how the sequence unfolds:
- Pre‑breakout observation: The heatmap shows short sellers aggressively piling into the $65,600 level. The low‑density gap above current price creates a perfect runway. A trader watching this map marks $65,600 as a cascade trigger and sets an alert at $65,300.
- Initial trigger: Spot buyers drive price above $64,800, wiping a few small short‑liquidation orders. Volume picks up. The heatmap gap allows rapid advance with almost no resistance.
- Momentum builds: As price crosses $65,200, algorithmic traders detect the approaching cluster and join the move, pushing price into the lower edge of the red zone. The first wave of $50M in short liquidations is executed, instantly adding buying pressure (shorts covering = buy orders).
- Cascade eruption: Within three 1‑minute candles, price rips through the entire $65,600 red cluster. The forced short covering eats through the remaining $200M, creating a short squeeze that spikes BTC to $66,400—1.2% beyond the cluster due to the overshoot effect.
- Post‑cascade adjustment: The heatmap repaints rapidly: the red short zone vanishes, replaced by a new orange long‑liquidation cluster at $66,200 as breakout buyers enter with high leverage. Traders who understood the cascade can bank profits near the overshoot and avoid getting trapped in the reverse move.
By studying the heatmap beforehand, a trader could have entered long at $64,600 with a stop below the orange long‑liquidation cluster, used a moderate 5x leverage to keep liquidation far away, and taken partial profits just before the $65,600 zone, letting the remainder ride into the cascade’s overshoot. The integration of the Smart Money API’s HIGH signal would have given extra conviction that the smart‑money flow supports the breakout, not a fake‑out.
Conclusion: Master Heatmap Signals for Leverage Trading
Liquidation heatmaps are no longer an exotic tool reserved for institutional desks. By learning to read color‑coded clusters, measuring cascade trigger distances, and sizing positions so your liquidation price never aligns with the red zones, you materially reduce blow‑up risk while capturing high‑probability breakout moves. The framework of identifying density, estimating cascade depth, and cross‑referencing exchange data gives you a genuine edge in derivative markets where the majority of retail traders are liquidated due to negligence of the very levels staring at them in the heatmap.
To elevate your heatmap analysis further, connect it to real‑time intelligence that goes beyond price. The Smart Money API offers a free API key that delivers composite confirmation scores fusing derivatives, on‑chain, whale wallets, and macro data. With a proven 62% win rate on HIGH-confidence signals, it can be the final layer that separates a hunch from a high‑conviction trade. Sign up today, pull the heatmap, check the score, and enter your next breakout with the confidence of data‑backed conviction.