On-Chain Metrics for Swing Trading (MVRV, Realized Price, Inflows)
Swing traders often rely on price charts alone, but blockchain data adds a fundamental layer of conviction. Three core on‑chain metrics form the backbone of a 3–7 day swing framework: the Market Value to Realized Value (MVRV) ratio, realized price, and exchange net inflows.
The MVRV ratio divides the market cap by the realized cap—the total value of all coins at the price they last moved. It answers the question: “Is the average holder in profit, and by how much?” Historically, MVRV below 1.0 signals undervaluation (average holder at a loss), while extreme highs above 3.7 (for Bitcoin) warn of profit‑taking. For swing trading, we care about the slope and local extremes on 4‑hour and daily resolutions.
Realized price is the realized cap divided by circulating supply—essentially the on‑chain cost basis of the aggregate market. Price trading below realized price often acts as a long‑term value zone, and a reclaim of realized price can ignite a swing move.
Exchange net inflows track the difference between coins sent to and withdrawn from exchanges. High inflows hint at selling pressure; declining or negative inflows (net outflows) suggest accumulation or reduced intent to sell. Because swing trades last days, not weeks, we need these metrics at higher frequency (Glassnode, CryptoQuant, or an API that normalizes them).
Together, these three create a foundation for spotting low‑risk entries and timely exits in a 3–7 day window.
Entry Signals: Combination of MVRV Ratio and Exchange Inflows
An actionable swing entry emerges when MVRV dips into historically low territory while exchange inflows dry up. This dual signal filters out false bottoms that often occur when MVRV is low but wallets are still rushing to deposit.
Step‑by‑step entry checklist
- Identify the MVRV threshold: For Bitcoin, a daily MVRV under 1.0 (or a 4‑hour MVRV oscillating between 0.9–1.1) is a candidate zone. For altcoins, use the 30‑day MVRV (Santiment) below ‑15 %.
- Check realized price proximity: The closer spot price is to realized price—ideally below it—the stronger the bottom signal.
- Monitor exchange inflows: On a 4‑hour chart, plot net exchange inflow (total balance on exchanges if you don’t have direction). An entry is valid only when the 3‑period moving average of inflows is flat or declining, and the latest candles show net outflows.
- Wait for a bullish price confirmation: On the 4‑hour chart, look for a bullish engulfing candle, a double bottom with higher low, or a reclaim of the 50‑period EMA while MVRV is still low. This prevents premature entries.
- Size your position: Calculate your position size using a position size calculator based on the stop distance to realized price or a swing low.
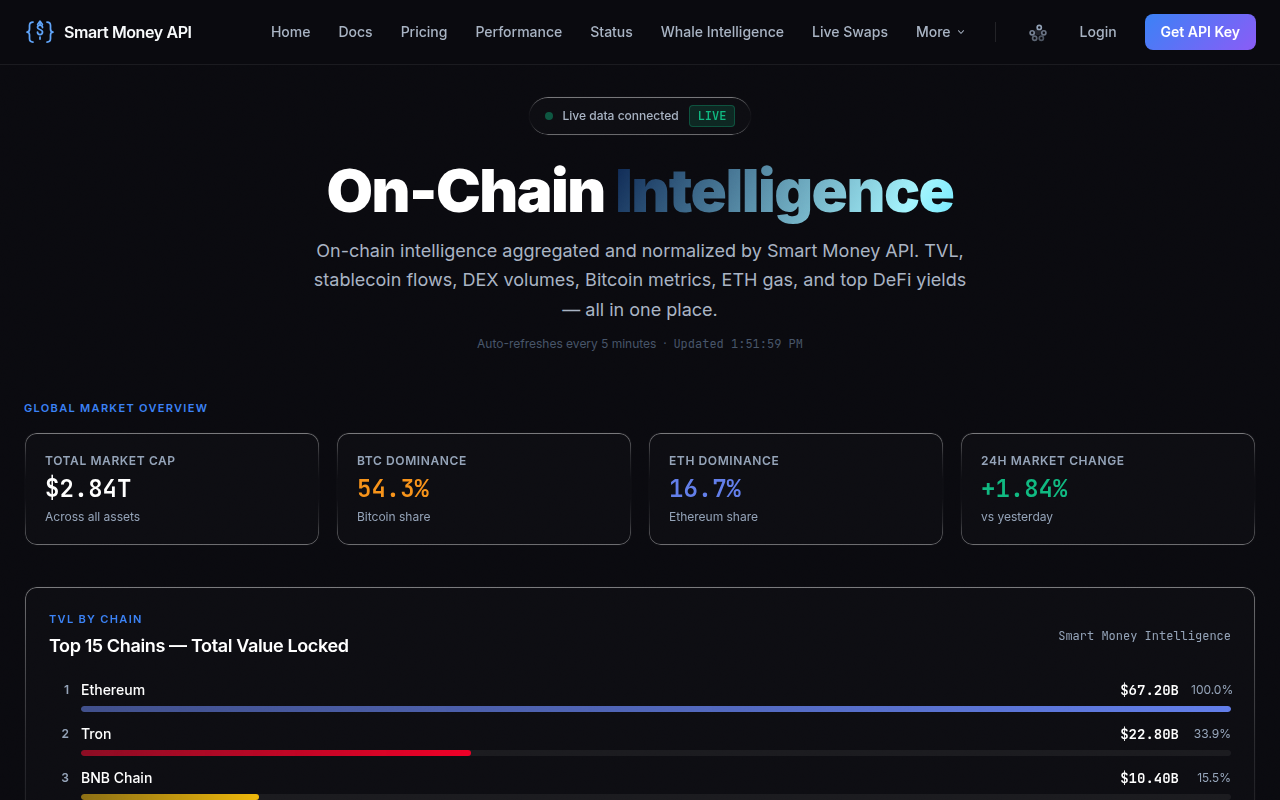
Because on‑chain data can lag, it’s wise to use a composite signal that fuses multiple inputs. The Smart Money API provides an on‑chain confirmation score that combines MVRV, exchange flows, and whale movements into a single composite value. When the composite exceeds 0.7 and the confidence label reads “HIGH,” you have a statistically backed edge.
Whale Accumulation + MVRV Low = Confidence Long Setup
Whale behavior adds a coordination dimension that pure MVRV cannot capture. When wallets holding 1,000 BTC (or $5M+ in stablecoins) are quietly accumulating while MVRV screams undervaluation, the odds of a sustained swing rise sharply.
How to validate whale accumulation
- Track whale net position change: Use a service that aggregates wallets with 1,000+ units (like Whale Alert or the Smart Money API’s whale score). Look for a consistent increase in total holdings over 3–5 days.
- Filter to smart‑money whales: Not all large wallets are “smart.” Exclude exchange wallets and known foundation addresses. The Smart Money API’s
whale_scorefocuses on 1,500+ active, high‑alpha wallets that have historically moved markets. - Combine with MVRV: A true confidence‑long setup appears when:
- Daily MVRV is below 1.0 (BTC) or the 30‑day MVRV is negative (altcoin),
- Whale net accumulation has been positive for at least 48 hours, and
- Exchange net flows are negative (net outflows).
- Wait for the composite signal: Instead of cross‑referencing three data streams manually, you can query an endpoint that does it. For instance, a call to the Smart Money API might return a composite score like 0.74, which combines derivatives, on‑chain, and whale data. The snippet below illustrates a real‑world confirmation that the setup is strong enough to trigger a long with a size multiplier of 1.5×.
GET /v1/confirm?symbol=BTC&direction=long
{
  "composite": 0.74,
  "confidence": "HIGH",
  "action": "CONFIRM",
  "size_mult": 1.5,
  "deriv_score": 0.81,
  "onchain_score": 0.68,
  "whale_score": 0.73
}
When you see a HIGH confidence reading like this during a low‑MVRV phase, you’re aligning with the smartest capital in the market—a textbook 3‑7 day swing entry.
Exit Signals: Realized P/L Spikes and Whale Distribution
Knowing when to take profit is just as critical. Two on‑chain metrics provide early warning: realized profit/loss spikes and whale distribution to exchanges.
Realized P/L as an overheat gauge
Realized P/L is the net profit (in USD) that coin holders are taking when they move their coins. A sharp spike on the 4‑hour or daily scale means a cohort is cashing out. For swing trades, watch for a realized profit value that exceeds the 0.95 percentile of the last 30 days. That usually marks a local top within the 3‑7 day horizon.
Whale distribution signals
- Monitor large exchange deposits: When a known whale wallet (or several 1,000+ BTC addresses) suddenly sends coins to an exchange, it’s a red flag. Data services tag these transfers.
- Check the whale score drop: The Smart Money API’s
whale_scorecan flip from bullish to bearish. If the composite confidence drops to “LOW” or whale score turns negative, close the position. - Combine with price exhaustion: Look for a bearish divergence on 4‑hour RSI or a shooting star candle while realized P/L spikes and whale deposits increase.
If even one of these conditions triggers, scale out 50 % of the position. Exit the remainder when a second condition confirms.
3-7 Day Swing Timing: Using 4h-1d Candle Confluence
On‑chain signals tell you when value exists; price action tells you when the market agrees. The sweet spot for a swing trade is a 2‑price‑candle confirmation on the 4‑hour or daily chart that aligns with on‑chain readings.
Building the confluence
- Identify the on‑chain event: MVRV z‑score below -1 + exchange outflows + whale accumulation. Note the price level at which this cluster appears.
- Zoom to 4‑hour timeframe: Draw the on‑chain support zone (realized price or the recent accumulation cost basis). Wait for a 4‑hour candle close above the midpoint of the zone with a wick that rejects lower prices (hammer or bullish engulfing).
- Add daily confirmation: Ideally, the following daily candle also closes green and above the prior day’s high. This confirms the swing’s momentum.
- Set a target based on on‑chain resistance: Use the MVRV ratio’s historical overvaluation level (e.g., 1.5–2.0 for BTC, or 30‑day MVRV reaching +20 % for an altcoin) as a take‑profit zone. Alternatively, use the next realized price band or the cost basis of the previous distribution cluster.
- Time exit: The typical 3‑7 day swing will reach the target within 4–10 4‑hour candles. If realized P/L spikes before the target, take partials early.
This timing approach benefits from a single dashboard that aggregates these scores. The Smart Money API mentioned earlier can display a live “confluence grade,” letting you skip the manual overlay work.
Risk Management: Stop-Losses at On-Chain Resistance Levels
On‑chain levels offer dynamic, objective stop placements. Because realized price represents the aggregate cost basis, a break below it signals that the average investor is underwater again—invalidating the long thesis.
Stop‑loss rules for swing longs
- Primary stop: Place the initial stop just below the recent on‑chain support cluster. If the swing entry was based on MVRV < 1.0 and realized price reclaim, set the stop 2–3 % below the realized price level.
- Trailing stop: After the price moves 5 % in profit, trail the stop to the last higher‑low on the 4‑hour chart or to the 4‑hour 50 EMA, whichever is tighter.
- On‑chain invalidation: If exchange net inflows suddenly spike above the 30‑day average, indicating rapid selling pressure, exit immediately regardless of stop distance. The Smart Money API’s confidence flag can also signal an early exit.
- Position size calculation: Use a position size calculator to ensure you risk no more than 1–2 % of your portfolio per trade, based on the distance from entry to on‑chain stop.
For short swings, mirror the logic: stop above the MVRV overvaluation level or the realized price of the recent distribution cluster.
Worked Example: Swing Trades with On-Chain Timing
Let’s walk through a Bitcoin swing trade that used MVRV, exchange flows, and whale data to capture a 6‑day move.
Date: February 2025. BTC had retraced to $58,200 after a failed rally. Daily MVRV was 0.92, price sat just below realized price ($58,900). Exchange net flows were negative for three straight days, and whale wallets with 1,000+ BTC had added 12,000 BTC over the prior week.
Entry: On the 4‑hour chart, a bullish engulfing candle closed at $58,400, reclaiming the 4‑hour 50 EMA. The Smart Money API returned a HIGH confidence composite of 0.74 (as shown earlier). We entered long at $58,400 with a 1.5× size multiplier, risking 1.5 % of the portfolio.
Stop: Set at $57,200, just below the prior swing low and the realized price level. Distance: 2.05 %. The position size calculator confirmed the allocation.
Target: MVRV 1.35 on the daily (a moderate overvaluation level), which historically aligned with $65,500. Partial profits would be taken at $63,000 if realized P/L spiked.
The trade played out over six days. On day 4, realized P/L spiked; we sold 50 % at $63,200. On day 6, price touched $65,600 and we closed the remainder. Total gain: 10.8 % on the full position (risk‑weighted ~7.2 % after partial take).
| Parameter | Detail |
|---|---|
| Entry price | $58,400 |
| On‑chain confluence | MVRV 0.92, outflows, whale accumulation |
| API confirmation | Composite 0.74, HIGH confidence |
| Stop‑loss | $57,200 (2.05 %) |
| First partial (50 %) | $63,200 (realized P/L spike) |
| Final exit | $65,600 (MVRV 1.35) |
| Swing duration | 6 days |
| ROI | 10.8 % (full); risk‑weighted 7.2 % |
To calculate your own profit percentage, a quick ROI calculator can help you compare setups.
The key takeaway: the on‑chain data provided the “why,” the price action gave the “when,” and the composite score from an API like Smart Money delivered the final go‑no‑go.
Get Started with On-Chain Swing Trading Today
You now have a repeatable framework—MVRV for value, exchange flows for intent, whale activity for conviction, and price confluence for timing. Tools like the Smart Money API condense these into a single score so you can bypass hours of research. Sign up for a free API key at smartmoneyapi.com/signup and start receiving HIGH‑confidence swing signals today. With disciplined risk management and on‑chain stops, your 3–7 day trades can finally benefit from the same insights that institutional desks rely on.